In my previous article I examined which Australian cricketers have played in the most ODI wins and which ones had the highest career success rates.
In this and following articles I will look at actual performances in wins and see who stands out.
First some criteria and an explanation of measures. This article will mostly concentrate on those 40 players from my previous article who achieved 50 career wins.
Averages and strike rates are both important in ODIs, more so in Tests where average is king. There is no completely satisfying way to combine the two to provide a definitive measure of ODI batting prowess. The balance between average and strike rate changes depending on where a player is situated in the batting order.
A top level player needs to provide a platform and sometimes bat through an innings, hence average is more important, although the days of Geoff Marsh plodding along to 80 from 155 balls are long gone. Conversely, a player coming in at number six will generally be required to up the run rate and take more risks.
In this scenario the balance is skewed more toward strike rate. There is an argument for a sliding scale depending on batting position, and then there is game scenario, pitch type and the era a player played in.
Frankly it’s all too complicated, so I will just use the basic (average multiplied by strike rate divided by 100) to provide a reasonable balanced figure.
For example, Michael Clarke has an average in wins of 50.95 and a strike rate of 81.52 (which incidentally are pretty darn good). This produces an average x strike rate measure of 41.53, which is actually good enough to be 20th all-time for Australia.
The average x strike rate measure appears to successfully provide a more balanced view of a batsman’s true value. Let’s consider the top tens for averages, strike rates and average x strike rate for those players with 50 career wins. Remember this is showing players’ records in their winning matches.
| Rank | Batting average | Strike rate | Average x strike date |
|---|---|---|---|
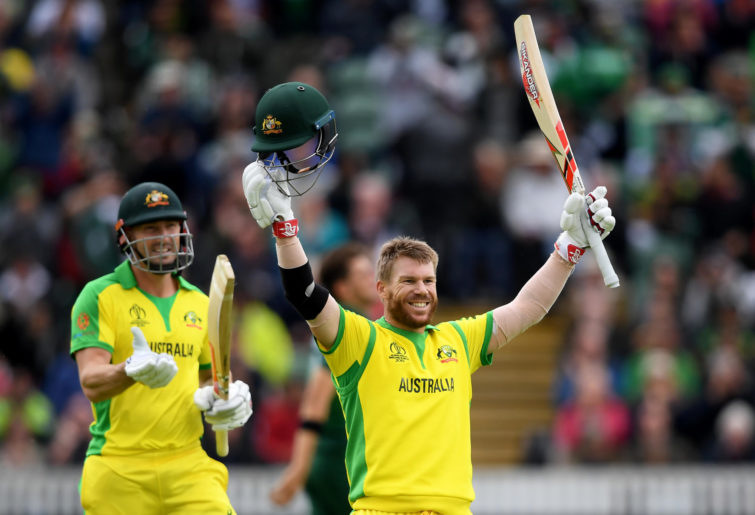
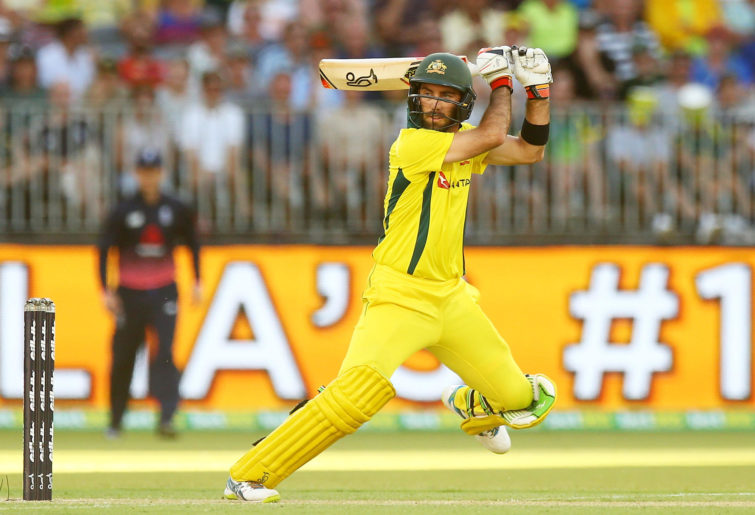
| 1 | Michael Bevan – 65.24 | Glenn Maxwell – 131.13 | David Warner – 56.65 |
| 2 | David Warner – 56.45 | Mitchell Johnson – 118.0 | Glenn Maxwell – 52.10 |
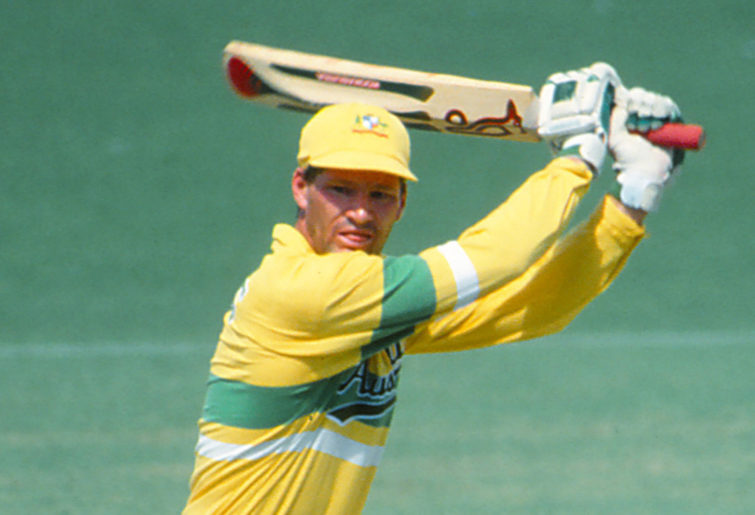
| 3 | Dean Jones – 56.25 | Craig McDermott – 108.25 | Michael Bevan – 49.35 |
| 4 | Damien Martyn – 52.46 | James Hopes – 106.37 | Mike Hussey – 46.25 |
| 5 | Mike Hussey – 51.24 | Mitchel Starc – 104.19 | Andrew Symonds – 46.18 |
| 6 | Michael Clarke – 50.95 | Ian Harvey – 103.32 | Steve Smith – 44.69 |
| 7 | Steven Smith – 49.76 | Jason Gillespie – 101.34 | Shane Watson – 44.19 |
| 8 | Ricky Ponting – 48.89 | David Warner – 100.36 | Aaron Finch – 43.05 |
| 9 | Andrew Symonds – 47.64 | Adam Gilchrist – 99.28 | Damien Martyn – 42.5 |
| 10 | Mark Waugh – 47.29 | Andrew Symonds – 96.93 | Dean Jones – 41.78 |
Batting average
Averages tend to favour the middle-order players. The field is back, the new ball is getting older, but the run rate pressure is not yet as urgent.
There are some notable exceptions. Michael Bevan was the great finisher so run rate was sometimes an issue. However he tended to hold the team together while those around him took the risks.
Mike Hussey was in a similar mould. He could really go when he wanted to. At nine and ten we have Andrew Symonds, who was more of an accelerator, and then Mark Waugh, our only opening batsman.
Strike rates
Strike rates are dominated by all-rounders and bowlers, generally coming in low down the order for a slog to get a team over the line. I won’t embarrass most of these players by showing their batting averages.
There are also a couple of openers tasked with getting a team off to a flyer while the fielding restrictions are in place: Gilchrist and Warner.

(Photo by Alex Davidson/Getty Images)
Two possible exceptions are Glenn Maxwell and Andrew Symonds. Despite his recent adventures at number seven (although it seems he rarely actually comes out at seven), these are both generally middle-order players, but they had a unique ability to score at a cracking pace through the middle overs.
And I love a good anomaly. Jason Gillespie at number seven on this list warms my heart.
Overall average x strike rate
David Warner strides to the fore with his combination of second best average plus eight best strike rate.
He is followed by Glenn Maxwell and Michael Bevan.
Each was, in their own ways, a unique resource for Australia.
Bevan’s average is miles in front of the other batsmen. But similarly so is Maxwell’s strike rate, while still maintaining an average sturdy enough to push him up this list.
(Mark Nolan/Getty Images)
The remainder of the top ten are the cream of Australian ODI royalty. Andrew Symonds is the only player apart from David Warner to appear in the top ten lists for both average and strike rate. Mike Hussey just missed out on this honour.
Top ODI performers Shane Watson and Aaron Finch push their way in due to a good combination of average and strike rate. Watson’s bowling also made him a white-ball MVP.
The peer difference percentage
The above analysis is not bad, but it disadvantages players from earlier eras, when strike rates weren’t what they were today. We have to find some way to even the score.
Those who have read my previous articles on Test cricket’s winners may remember the peer difference percentage. This is where I compare the performance of a player in wins against his fellow players in those same wins. This measure aims to determine how important a player was in his successful matches.
Again using Michael Clarke, his peer differences looks like this: average: +12.57 per cent, strike rate: -7.53 per cent, overall average x strike rate: +3.58 per cent.
This tells us that Clarke contributed 12.57 per cent more runs to his wins than his peers in the top six in those same matches, but he did it at a 7.53 per cent slower scoring rate. This makes sense as Clarke was generally tasked with guiding his teams through the middle overs. Clarke’s overall contribution, combining average and strike rate, was slightly more than his teammates’.
To put Clarke’s performance into some perspective his peer difference for batting average is sixth best for all players with at least 50 career victories.
Let’s recast our table using the peer difference percentage.
| Rank | Batting average | Strike rate | Average x strike date |
|---|---|---|---|
| 1 | Dean Jones – +53.44 | Craig McDermott – +53.41 | Dean Jones – +48.43 |
| 2 | Michael Bevan – +48.58 | Glenn Maxwell – +47.26 | David Warner – +44.5 |
| 3 | David Warner – +42.60 | Mitchell Johnson – +35.23 | Michael Bevan – +32.87 |
| 4 | Geoff Marsh – +17.13 | Simon O’Donnell – +27.21 | Glenn Maxwell – +25.72 |
| 5 | Mike Hussey – +13.94 | Ian Healy – +26.90 | Mike Hussey – +18.04 |
| 6 | Damien Martyn – +13.59 | James Hopes – +26.72 | Mark Waugh +13.23 |
| 7 | Michael Clarke – +12.57 | Jason Gillespie – +22.00 | Andrew Symonds – +13.23 |
| 8 | Mark Waugh – +11.87 | Adam Gilchrist – +20.65 | Allan Border – +12.45 |
| 9 | David Boon – +6.76 | Ian Harvey – +20.45 | Shane Watson – +10.61 |
| 10 | Ricky Ponting – +6.19 | Andrew Symonds – +16.67 | Damien Martyn – +8.53 |
Dean Jones is the big winner here. His batting average in wins was over 53 per cent better than his batting partners and his strike rate was nearly seven per cent better as well. As a result, Jones rockets from tenth to first on the adjusted overall ranking.
Bevan and Warner are still right up there with their batting averages and although Warner drops out of the top ten for strike rate, he still scored nearly 12 per cent quicker than his peers, which gives him second place behind Jones. Bevan rounds out our top three. Maxwell drops to fourth and Mike Hussey rounds our top five performers in wins. That feels pretty right to me.
Two new players enter each of our average, strike rate and overall top tens. Geoff Marsh – the 1980s anchor opener – now has the fourth best batting average difference in comparison to peers. His sometime partner at the top of the order David Boon also enters the top ten.
For strike rate, the great hitter Simon O’Donnell and legendary keeper Ian Healy both enter the top five. Craig McDermott knocks Glenn Maxwell off his perch as fastest scorer in comparison to his peers. It should be noted that McDermott’s batting average was a massive 9.8.
Looking at overall average x strike rate, the great ODI opener Mark Waugh comfortably enters the top ten with an average nearly 12 per cent better than his peers and a scoring rate 4.3 per cent quicker. The other entry is the great Allan Border. Generally considered more of a Test player, Border scored nearly 12 per cent more quickly than his peers while maintaining a decent average.
So in winning performances, our standout top six batting order would be David Warner, Mark Waugh, Dean Jones, Mike Hussey, Michael Bevan and Glenn Maxwell.
(Photo by Getty Images)
Other notables
This analysis was restricted to batsmen with at least 50 wins. If that criteria is relaxed to ten wins, the following new players emerge.
Adam Voges is again the statistical anomaly. Voges has an average in 17 wins of 69.62, four clear of the next best, Michael Bevan. Voges is one of only two players to have an overall mark (average x strike rate) greater than 60.
But he is pipped by… John Hastings! With nine not outs from 11 innings, Hastings averaged 63 with a strike rate of nearly 106. Other players in the top 20 of the overall measure include Greg Chappell, Phillip Hughes, Nathan Hauritz (!), James Faulkner, Travis Head, Peter Handscomb and Mitchell Marsh. There are some interesting names there.
The best score setters
So who does best when Australia bats first? In terms of batting average four players averaged over 50 in wins when batting first: David Warner, Michael Bevan and Dean Jones… and Nathan Hauritz.
Hauritz had 12 not outs in 15 innings to score 181 runs at an average of 60 and a strike rate of 114. Two others to feature highly on the overall measure are modern masters Steve Smith and Glenn Maxwell. So only one surprise there.
Mike Hussey and Andrew Symonds were also excellent, with nearly identical averages over 46 and strike rates over 96. If I had to pick the oddest entry in the top 20 averages apart from Hauritz, it would probably be 1980s opener Graeme Wood, who averaged 48.5 when setting a target.
The best chasers
There is no contest here. James Faulkner chased successfully 14 times. He remained not out an amazing 12 times, averaged 152 and struck at 117.37. His overall measure is a whopping three times his nearest competitor.
Other regulars, Bevan and Hussey, plus Michael Clarke and Greg Chappell also average more than 70 in chases.
(Photo by Hamish Blair/Getty Images)
When strike rate is factored in, it is underrated all-rounder Shane Watson who emerges with a overall measure second only to Faulkner. Bevan, Clarke and Maxwell round out the top five using the overall measure. There are no real surprises in the top averages in chases.
For strike rate, apart from Faulkner and Maxwell, the only other players to strike at more than 100 in chases are Adam Gilchrist and 1980s batsman-keeper Wayne Phillips. When chasing, Phillips averaged 30.44 but struck at 108.3. Considering his ODI career was all between 1984 and 1986, that strike rate is truly remarkable.
The best losers
When Australia lost there are seven players with an overall average x strike rate measure greater than 30. They are Mike Hussey, Matthew Hayden, Marcus Stoinis, George Bailey, Usman Khawaja, James Faulkner and Alex Carey.
These players fight to the finish. You could add Michael Bevan to that list as the only player to join Hussey and Hayden in averaging over 40 in losses.
Hussey and Bailey were way ahead of others when setting a total that ultimately couldn’t be defended. In forlorn chases it was Matthew Hayden and Marcus Stoinis, two similar style biffers, that fought hardest, both averaging over 50.
matth
Roar Guru
Just when I write them Micko. I did the test stats first and then moved onto ODI’s.
Micko
Roar Rookie
Geez Matt, did you plan to release these articles now, or did the Roar hold on to them for a while? I feel you'd be getting more traffic before the ODI's commenced.
Mick Jeffrey
Roar Rookie
Looking purely at strike rates I'd never have picked James Hopes as a high strike rate player, especially when I generally saw him as a bowling all rounder.
Chris Kettlewell
Roar Guru
Yeah, exactly. You'd think that a 25 year old in that situation would be just getting better and better over the next four years and be close to his peak 4 years later. It's amazing to think that someone who was such a central part of Australia's ODI set up so many years ago, who's been out for so long, is still only 30 now! No reason why, if he gets himself together, he can't get to a point of being even better than he was at 25.
Rellum
Roar Guru
Well I would throw swampy in there as well. We do not win the 87 world cup without his performances.
matth
Roar Guru
Basically Australia didn’t win in the 1980’s unless Deano fired. In ODI’s at the time he was streets ahead of his teammates.
matth
Roar Guru
Maybe, which is why I finish with the best in losses as well. I am looking for the players who perform when Australia wins and by how much they outperform their teammates in wins. If I was to subjectively decide for each match how strong the opposition were we could be in for a long haul.
Brian
Guest
Don't these lists favour downhill skiers. It doesn't matter how many tons Warner or Watson scored beating Bangladesh. I prefer S Waugh making a gritty 50
The Bush
Roar Guru
He also got in trouble for drink driving at one point - from memory it was right around the time he scored his first FC century, so he was literally on the verge of breaking into another level with his cricket. Crazy to think that a 25 year old can be player of a World Cup final, but isn't even in the squad four years later. He added to much balance and depth to our side at his peak.
matth
Roar Guru
Kohli is likely his nearest rival. Or AB de Villiers maybe.
matth
Roar Guru
I think you will find that each country will have one or two standouts that are at least the same level as our best. Our strength is in our depth and consistency. But remember also South Africa have an overall higher winning % in ODI’s compared to Australia and India have also been as good if not better recently. So they will have comparable players.
Chris Kettlewell
Roar Guru
Yeah, Faulkner just lost form badly, then I think had some injury issues. India were the first team to start just sitting on the slower ball whenever he bowled and he became too predictable and just got taken apart. And he didn't do much with the bat for a while either. After he'd got dropped from the Aussie team he then also had some injury issues also I believe. The thing is, he's still only 30!!! He should be right in his prime right now. So if he is fully healthy and can get himself back to his best, there's no reason he can't still get back into the Australian side for another 5 years of ODI / T20 cricket. Would love to see it, because he is the sort of player we could really do with.
Chris Kettlewell
Roar Guru
Viv Richards would have to totally top the list worldwide when you compare to peers. His average of 47 with a strike rate of 90 back when he played was just incredible. A player with those stats now would be considered one of the best ODI batsmen in the world. To do those stats back when Richards did them was just insane.
Cricket fan
Roar Rookie
I believe he played for a long time with a niggle. Then, because of it, his form began to drop off domestically, especially in bowling. I believe he also became too predictable with his back of the hand shower ball. He was omitted due to injury and average form for a while too. His batting hasn't seemed to be the same since around 2015 either, although his bowling this season for the Hurricanes looks much better, and he's rediscovered how to swing the ball.
The Bush
Roar Guru
But do you think even India or South Africa could possibly have had so much talent? Although I guess our strength in ODI cricket was as much our bowling and fielding as it was our batting.
Micko
Roar Rookie
What ever happened Faulkner? He doesn't seem to play any first class or OD cricket any more.
matth
Roar Guru
There would be some standout players on the world stage, no doubt. Tendu,kar, Vic Richards and Kohli would probably be your middle order. After I’ve in is he’d with the Australians I might do the same for the rest of the cricketing world.
Rellum
Roar Guru
It just shows how great Dean Jones was. Swampy Marsh is a criminally underrated ODI player.
The Bush
Roar Guru
With 5 world cups and more time as number one than basically every other country combined, I’d be amazed if another country had anything like that wealth of talent.
bazza200
Guest
Hi great work thanks for your piece. I love reading about cricket and takes on the game as these golden era's pass me by more it is enjoyable to reflect on the greatness we witnessed. I was surprised about Dizzy in the top for strike rate. Given i would of though he would of batted maybe at 9 so you get a few more bats then an 11. Also James Faulkner had a really golden period batting and bowling wise not sure there was a better period for an all rounder than he had. Watto was a steady alrounder and def a force in limited overs. I wonder how australia's best compares to other countries ?