One of my first articles for The Roar featured a throwaway line mentioning that, compared to population, the Broncos were not as successful as the nine NRL clubs in Sydney who fight for the same populations with smaller local regions.
As a data analyst and a massive mapping nerd, it never sat right with me that I did not prove this – so I set about bit by bit pulling together a whole host of metrics to empirically prove which NRL team represents the most rugby league mad region compared to the individual populations that each team is supposed to represent.
Sports analytics is a passion of mine but less so run metres, tackle busts and try assists and more indicators of passion, engagement and mobilisation with different clubs.
With 2023 seeing the introduction of the Dolphins, it has been a great year for the statsheads among us. The new club has been a a success by pretty much any metric one might have in an incredibly short space of time.
2023 also so far represents the highest recorded average crowd attendance with crowds up 24% higher than 2022.
Whether the reason is the end of the pandemic, a competitive competition or the injection of a new team in the heartlands, the crowds are booming by league standards.
I mapped out the territories of the NRL’s 17 teams and compared those populations represented in each catchment and compared to attendances, memberships, social media followers and registered club players or participants that could be openly sourced.
The data when adjusted will show which teams have the most passionate fan bases and the most participatory rugby league populations in Australia.
For teams outside of NSW, this was a relatively simple process, but when plotting the Sydney-based teams, I was presented with a complex patchwork of regions creating a more complicated process with special mention to this publicly available ESRI map which plots out each team at a suburb level.
The one adjustment I made was the development that the North Sydney Bears have a feeder agreement with the Sydney Roosters and so this area goes to them.
The full interactive results can be found here, but let’s talk through them individually.
Attendances
Heavyweight Rankings
1. Broncos: Home: 36,148, Away: 21,593, Home and Away: 28,870
2. Rabbitohs: Home: 22,961, Away: 23,549, Home and Away: 23,255
3. Roosters: Home: 24,252, Away: 21,665, Home and Away: 22,958
4. Dolphins: Home: 25,980, Away: 19,816, Home and Away: 22,898
5. Eels: Home: 18,935, Away: 24,085, Home and Away: 21,510
6. Panthers: Home: 19,899, Away: 22,296, Home and Away: 21,097
7. Cowboys: Home: 21,540, Away: 18,449, Home and Away: 19,994
8. Storm: Home: 18,833, Away: 20,311, Home and Away: 19,572
9. Bulldogs: Home: 18,702, Away: 20,429, Home and Away: 19,566
10. Warriors: Home: 20,263, Away: 18,792, Home and Away: 19,528
11. Titans: Home: 21,550, Away: 16,574, Home and Away: 19,062
12. Knights: Home: 17,129, Away: 18,449, Home and Away: 17,789
13. Raiders: Home: 14,777, Away: 19,415, Home and Away: 17,096
14. Dragons: Home: 13,208, Away: 20,302, Home and Away: 16,755
15. Tigers: Home: 14,605, Away: 18,384, Home and Away: 16,494
16. Sea Eagles: Home: 14,384, Away: 18,490, Home and Away: 16,437
17. Sharks: Home: 11,014, Away: 19,507, Home and Away: 15,261
To nobody’s shock the Suncorp-based Broncos are top dogs by a fair margin over the Rabbitohs. The Roosters are next highest with their strongest crowds at Allianz Stadium, while Dolphins in their inaugural season round out the top 4.

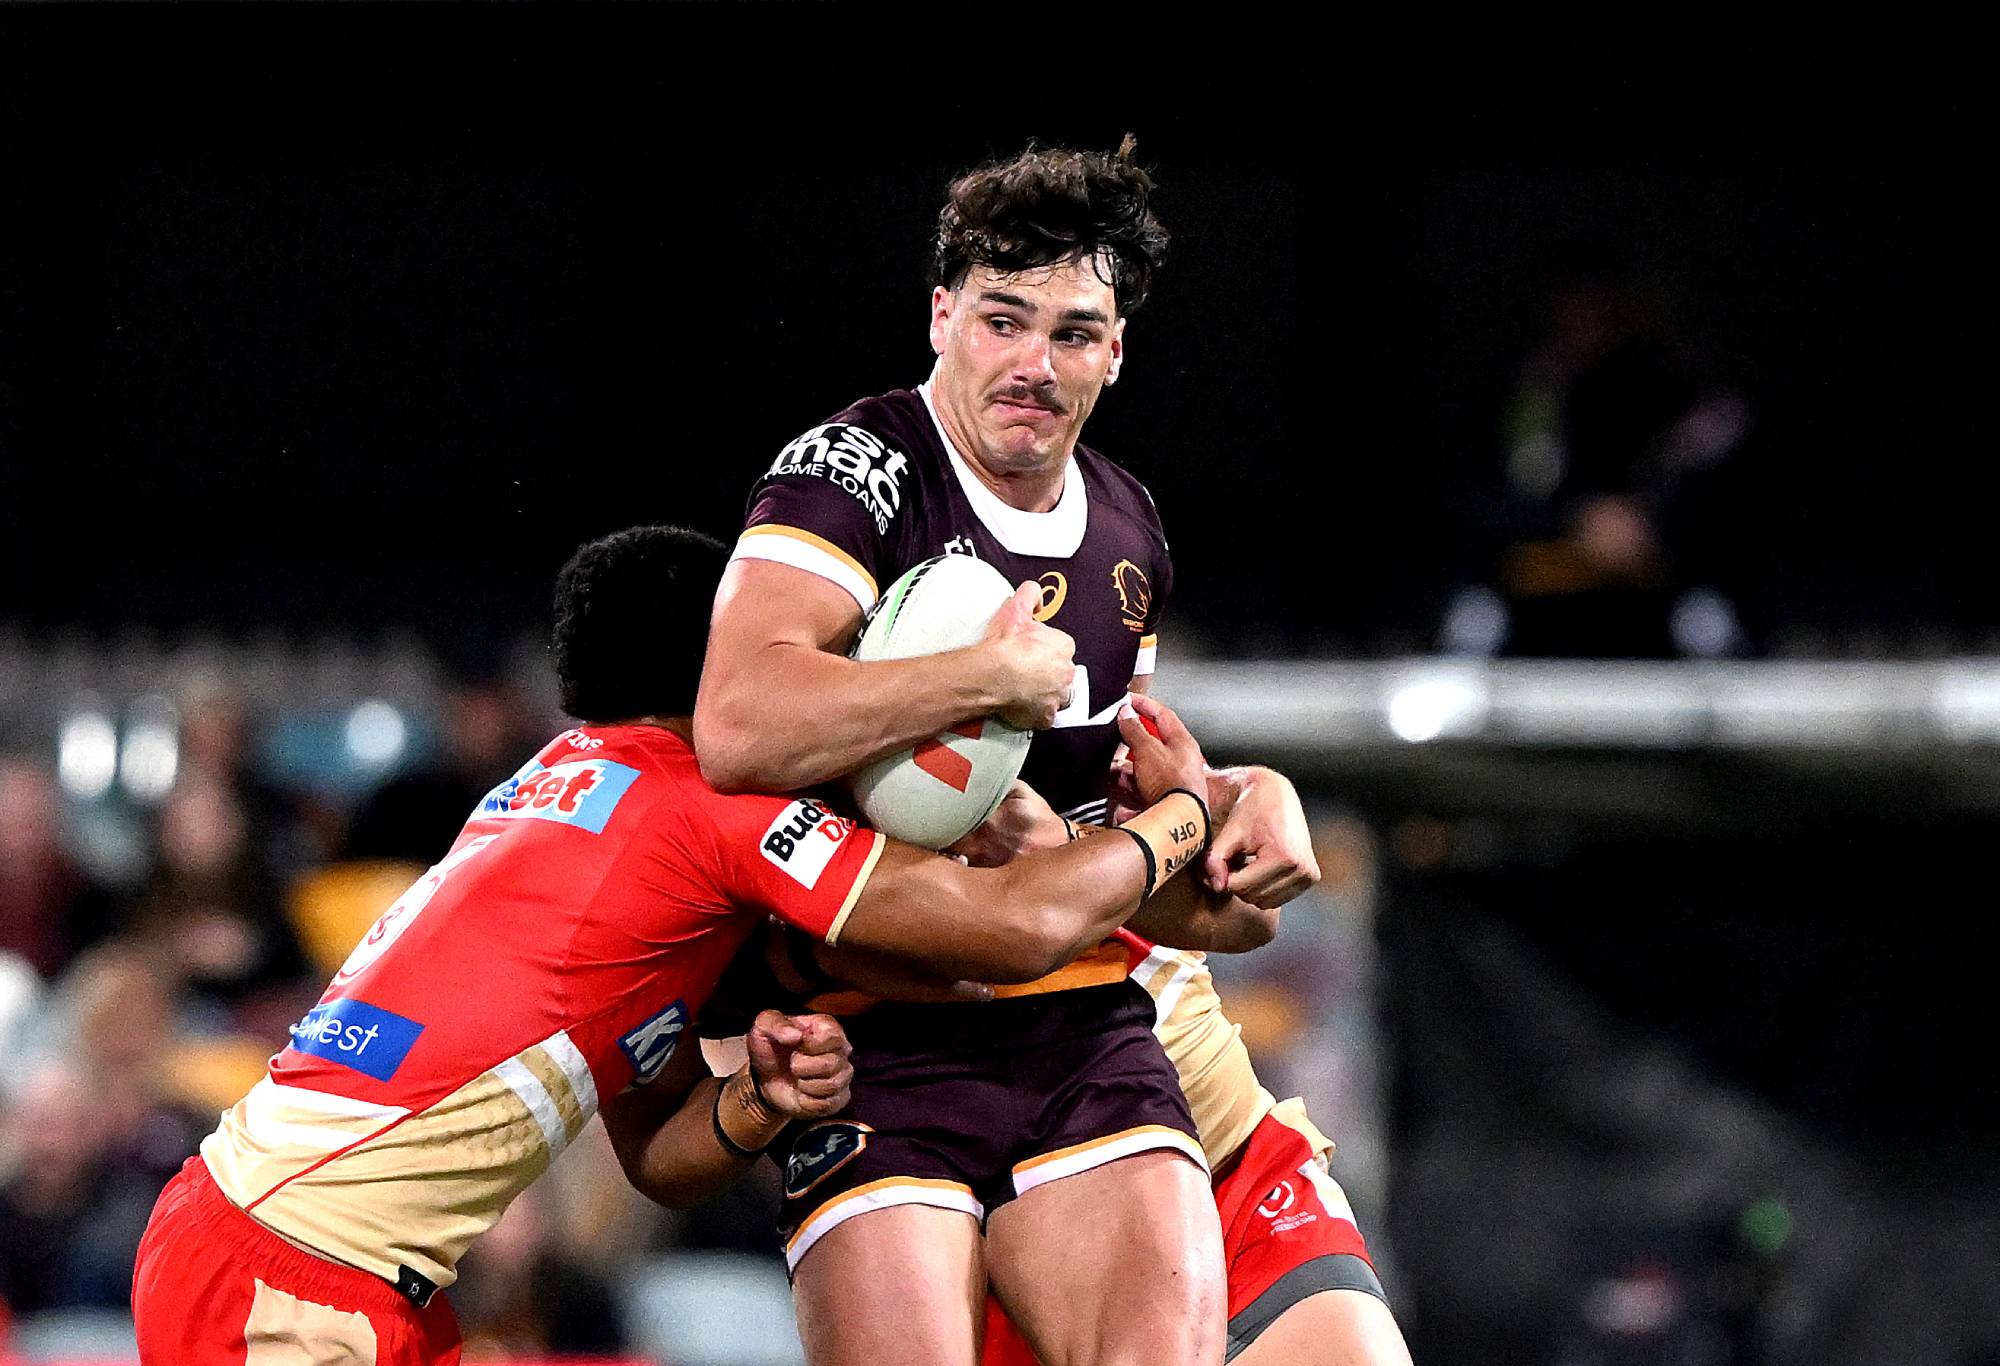
(Photo by Bradley Kanaris/Getty Images)
Now let’s look at average home crowds compared to the region.
1. Cowboys: 9.2%
2. Sea Eagles: 5.8%
3. Dolphins: 5.7%
4. Sharks: 5.5%
5. Rabbitohs: 5.5%
6. Knights: 4.5%
7. Roosters: 3.8%
8. Panthers: 3.6%
9. Raiders: 3.1%
10. Dragons: 2.9%
11. Titans: 2.2%
12. Bulldogs: 2.1%
13. Eels: 1.8%
14. Tigers: 1.6%
15. Broncos: 1.5%
16. Warriors: 1.1%
17. Storm: 0.3%
In what will be a growing theme, the Cowboys shoot to the top with the average home attendance equivalent to 9.2% of the city’s population of 195,564 on average turning up to support their team.
Manly jump from 16th to second with 5.8% of their 264,481 residents turning up regularly to Brookvale and 5.7% of Dolphins territory, which has been mapped to Moreton Bay and part of Northern Brisbane based on its catchment juniors with a population of 545,459.
The Shire rounds out our top four with 5.5% of the 239,301 Sutherland Shire residents. The Broncos fell to 15, validating my original idea.
What about capacity? This is sometimes this is neglected when we look at attendance: sure., you have 30,000 people, but what if your stadium is 80,000 while in a local stadium, you might get 11,000 people but in a stadium of 15,000. Surely this needs to be recognised?
Well let’s see:
1. Panthers: 81%
2. Sea Eagles: 80%
3. Cowboys: 77%
4. Dolphins: 75%
5. Sharks: 72%
6. Broncos: 72%
7. Knights: 71%
8. Warriors: 69%
9. Raiders: 67%
10. Titans: 65%
11. Roosters: 64%
12. Eels: 63%
13. Dragons: 62%
14. Tigers: 62%
15. Storm: 57%
16. Bulldogs: 36%
17. Rabbitohs: 35%
In what may be surprising Panthers our now our MVP with BlueBet Stadium. Interestingly, one-off regional games are the most filled stadiums with an average with 82% or 18,350 out of 22,500.
The Sea Eagles, Cowboys and Dolphins again round out our top four. The Bulldogs and Rabbitohs take a massive hit here with Accor Stadium (Homebush) with an average 22% attendance.

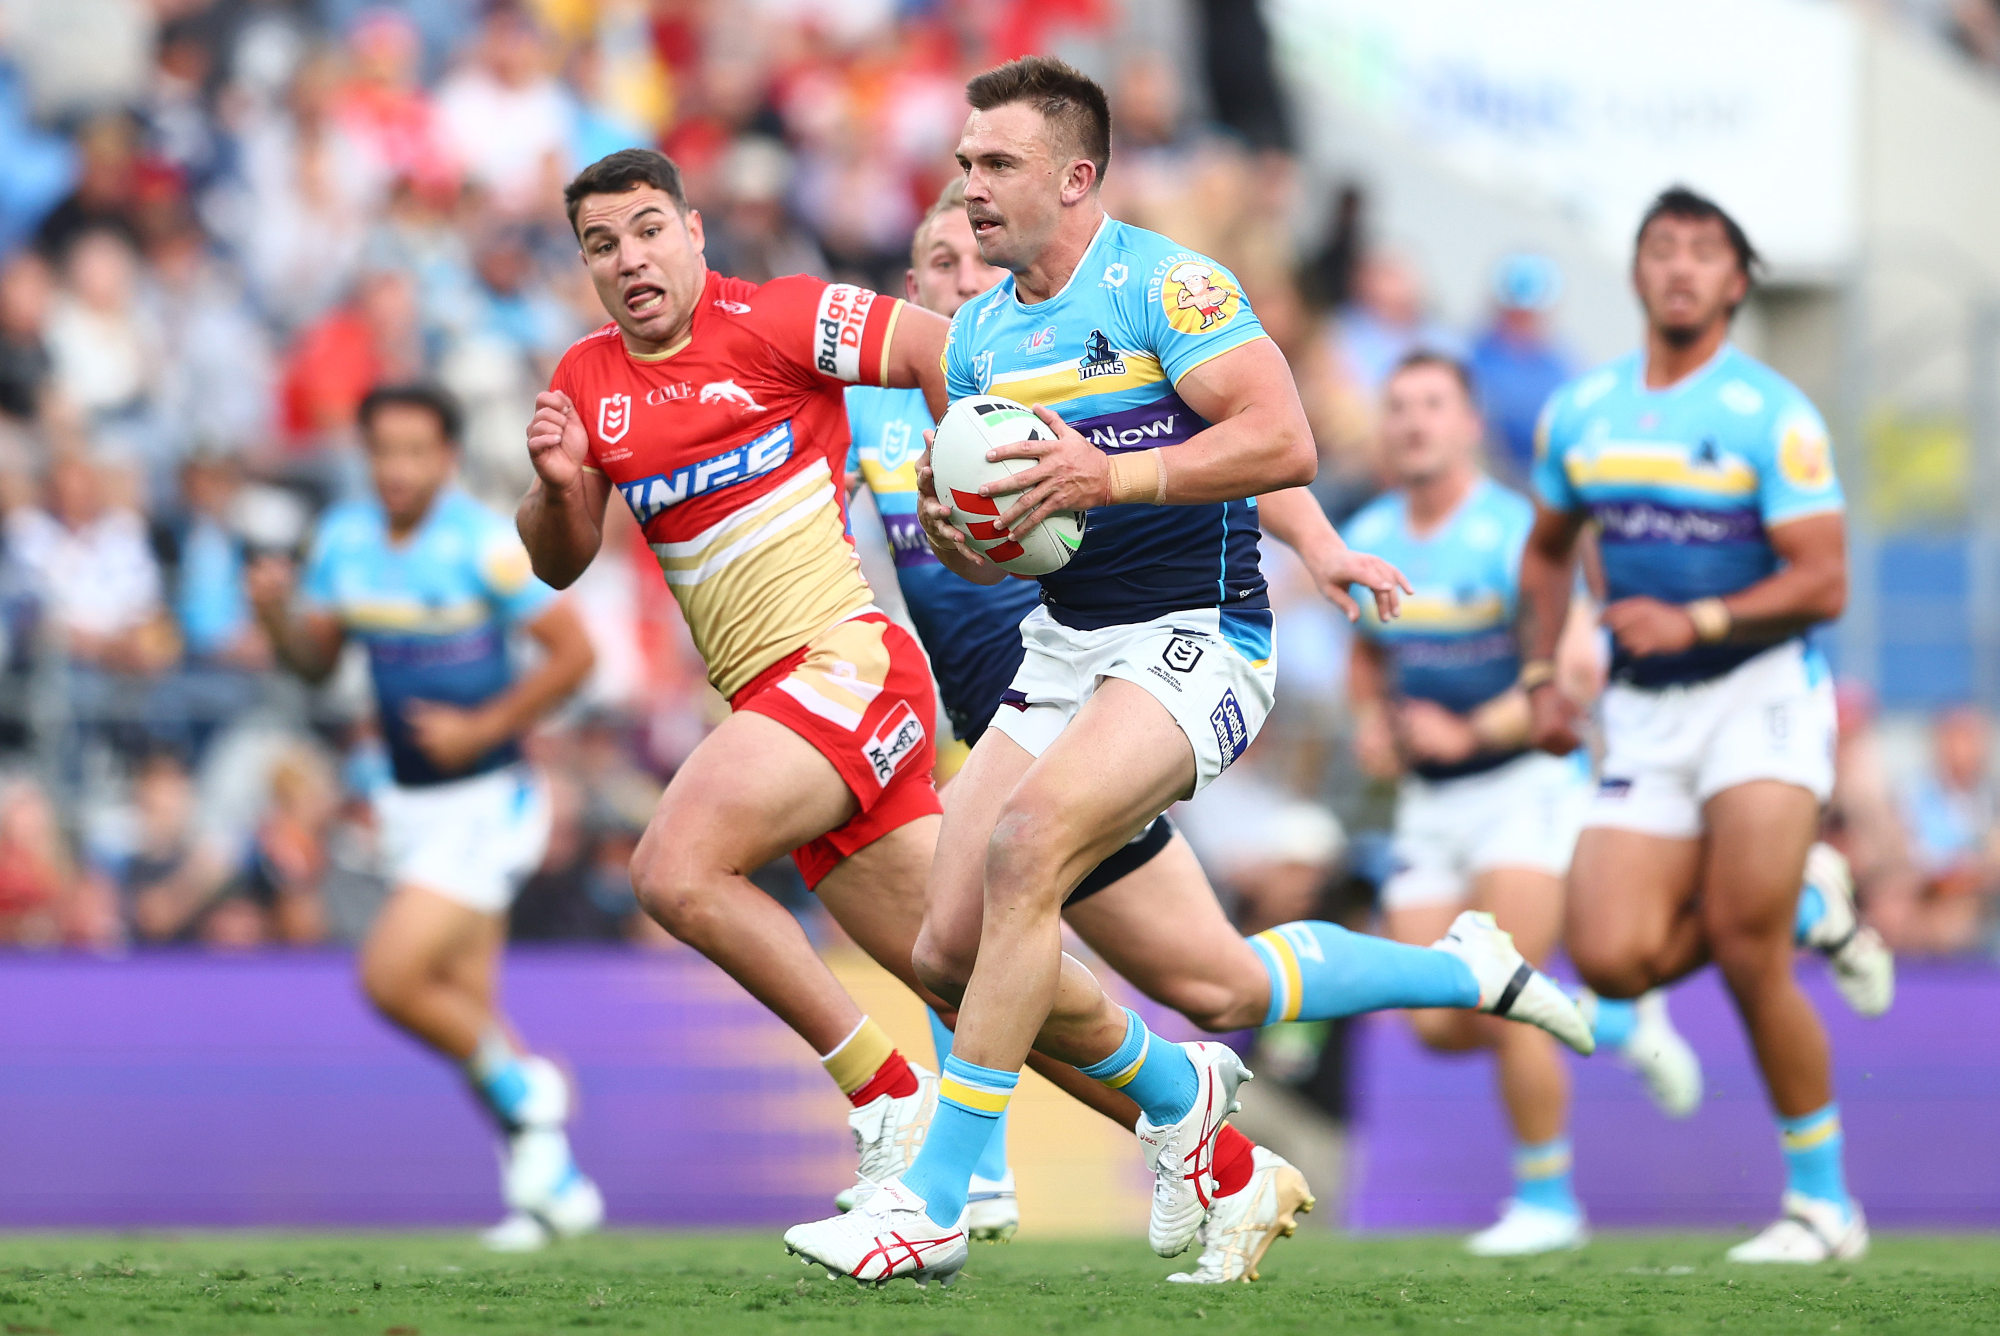
GOLD COAST, AUSTRALIA – JULY 09: Chris Randall of the Titans makes a break during the round 19 NRL match between Gold Coast Titans and St George Illawarra Dragons at Cbus Super Stadium on July 09, 2023 in Gold Coast, Australia. (Photo by Chris Hyde/Getty Images)
Memberships
Memberships are always a bit rubbery. I have two main sources for this: the NRL membership tracker, which we have had to assume is the most authoritative, plus an open source NRL membership tracker.
Unfortunately, Penrith and the Warriors do not have available figures to prevent this gap I have averaged out the previous years prior to the pandemic as a proxy. Numbers have been compared to 2017 to see which teams have grown or decreased their members.
• Broncos: 40,207 members (9.72% increase, +3,909 members)
• Eels: 32,376 members (24.32% increase, +7,875 members)
• Rabbitohs: 31,067 members (2.73% increase, +847 members)
• Dolphins: 28,594 members (inaugural season, +28,594 members)
• Raiders: 23,550 members (18.93% increase, +4,459 members)
• Bulldogs: 21,571 members (12.69% increase, +2,738 members)
• Storm: 20,592 members (0.41% increase, +85 members)
• Cowboys: 20,117 members (-10.74% decrease, -2,161 members)
• Tigers: 20,003 members (9.64% increase, +1,929 members)
• Roosters: 19,798 members (19.18% increase, +3,797 members)
• Panthers*: 19,085 members
• Knights: 18,139 members (26.29% increase, +4,769 members)
• Warriors*: 16,472 members
• Sea Eagles: 15,766 members (16.51% increase, +2,603 members)
• Sharks: 15,230 members (-2.51% decrease, -383 members)
• Dragons: 13,318 members (-44.02% decrease, -5,863 members)
• Titans: 8,025 members (-36% decrease, -2,889 members)
Unsurprisingly, the Broncos dominate and have seen strong growth this year, the Eels, Rabbitohs and Dolphins fill out our top four with the Dolphins’ growth a huge achievement.
Let’s see how our teams rank adjusted by population.
1. Cowboys: 10.3%
2. Rabbitohs: 9.3%
3. Sharks: 6.6%
4. Sea Eagles: 6.0%
5. Dolphins: 5.2%
6. Raiders: 5.2%
7. Dragons: 4.8%
8. Knights: 4.6%
9. Panthers: 4.0%
10. Eels: 3.4%
11. Roosters: 2.9%
12. Bulldogs: 2.7%
13. Tigers: 2.3%
14. Broncos: 1.8%
15. Titans: 1.2%
16. Warriors: 1.0%
17. Storm: 0.4%
Again, we see the Cowboys representing a huge footprint of 10.3% in their region followed by the Rabbitohs at 9.3%. Cronulla (6.6%) and the Sea Eagles (6%) jump from 15 and 14 to the top four.
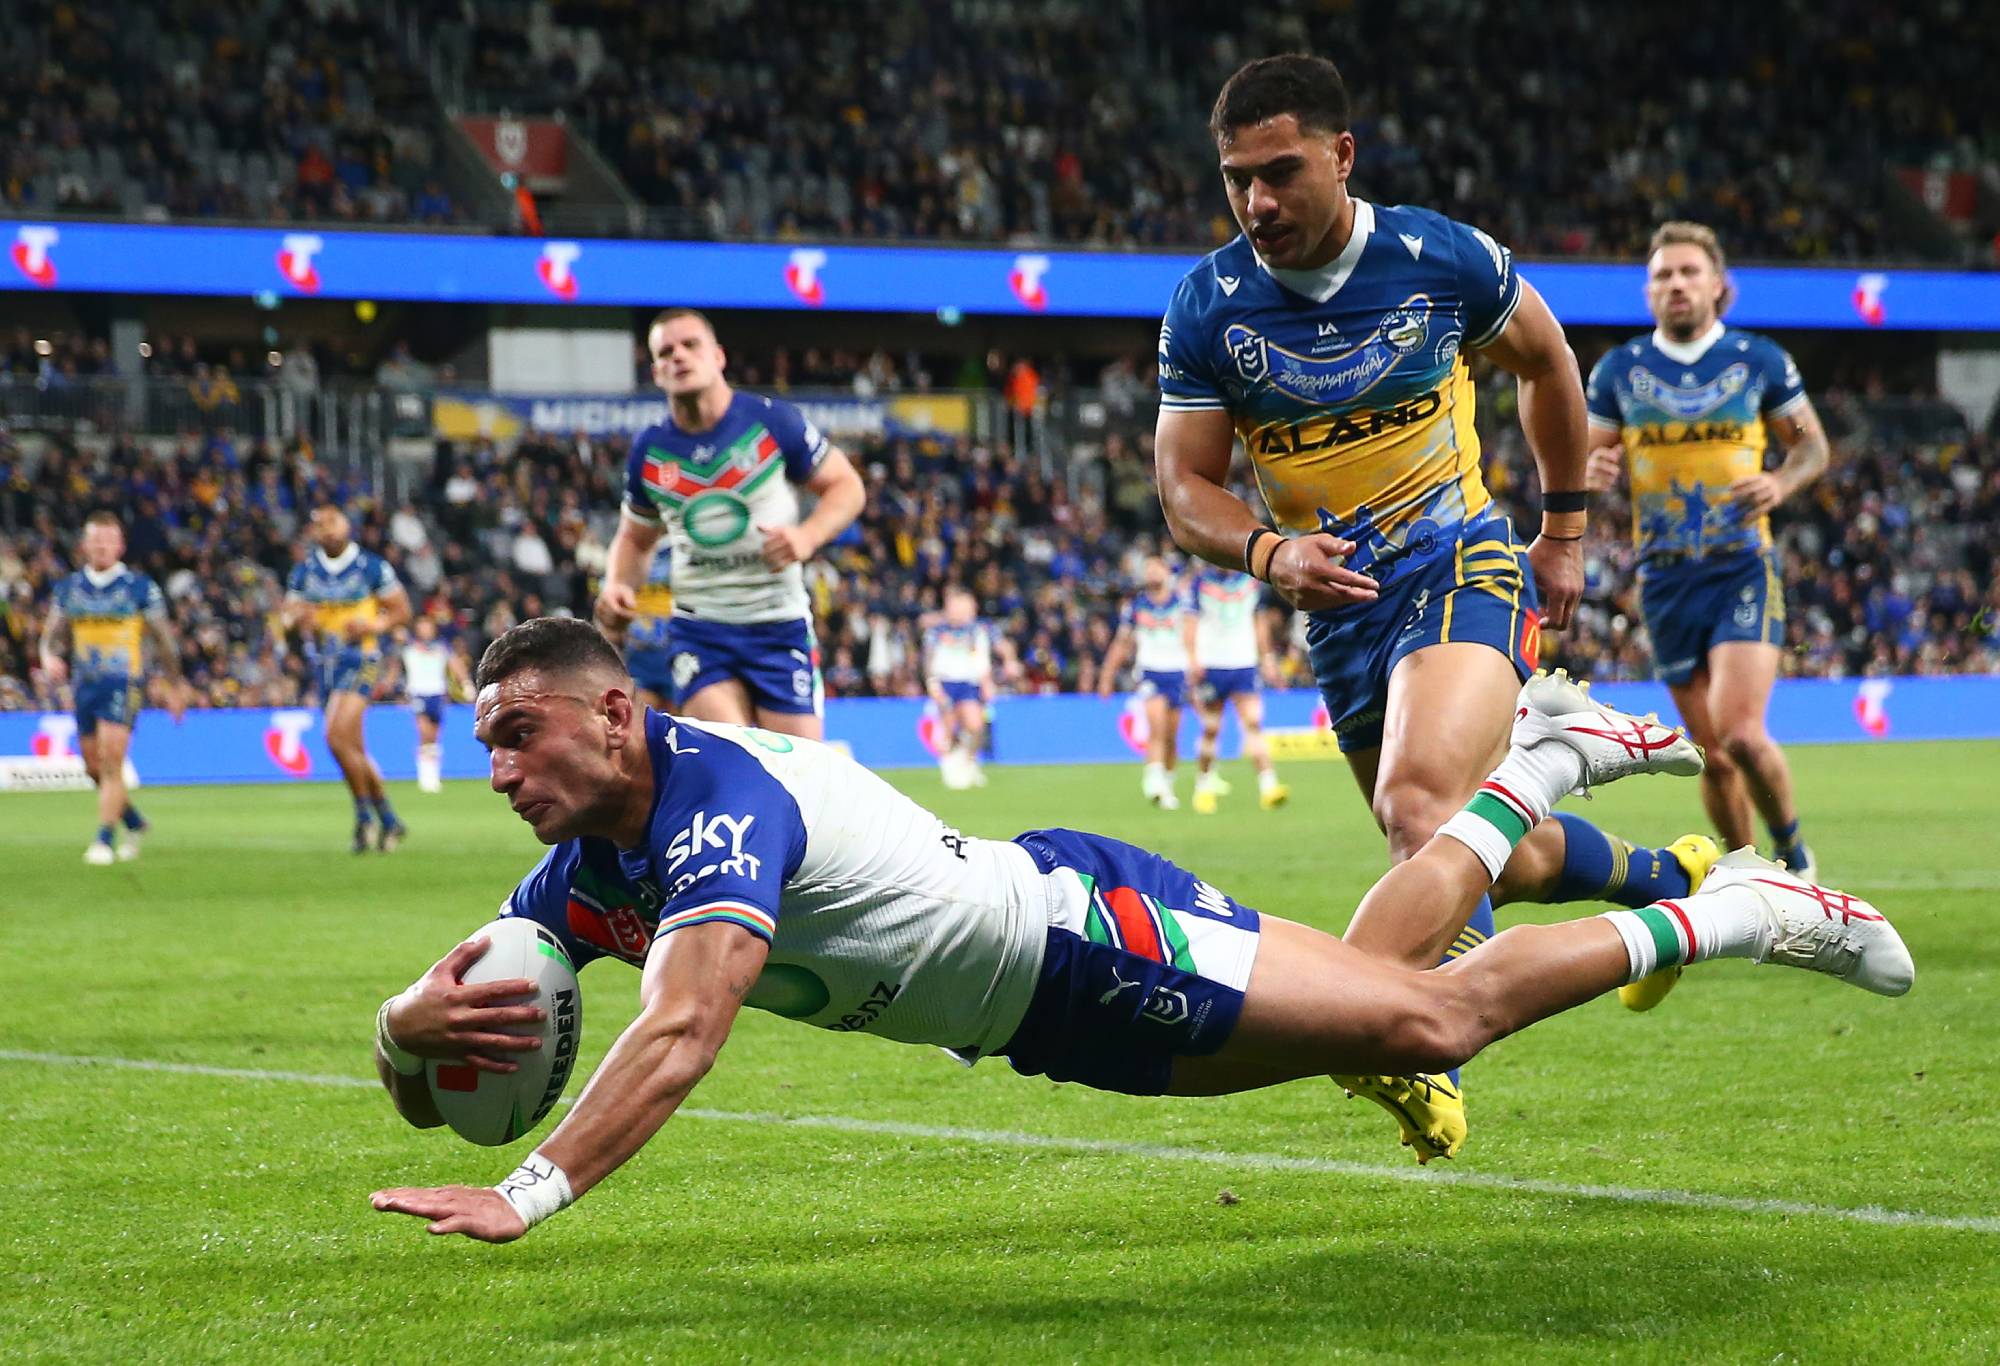
(Photo by Matt Blyth/Getty Images)
Social Media
When we look at social media, our largest social brands are the Broncos who rank as having the largest following of any club team across all competitive football competitions in Australia – exceeding the AFL’s largest, Collingwood, and even the Socceroos.
The Storm, Rabbitohs and Warriors round out our top four. The Dolphins, although last, have made significant strides in a short space of time.
1. Broncos: Instagram Followers: 386,000, Facebook Followers: 688,000
2. Storm: Instagram Followers: 335,000, Facebook Followers: 582,892
3. Rabbitohs: Instagram Followers: 302,000, Facebook Followers: 497,070
4. Warriors: Instagram Followers: 290,000, Facebook Followers: 457,000
5. Eels: Instagram Followers: 224,000, Facebook Followers: 366,764
6. Cowboys: Instagram Followers: 234,000, Facebook Followers: 328,663
7. Panthers: Instagram Followers: 278,000, Facebook Followers: 267,619
8. Bulldogs: Instagram Followers: 210,000, Facebook Followers: 290,000
9. Roosters: Instagram Followers: 233,000, Facebook Followers: 265,686
10. Tigers: Instagram Followers: 149,000, Facebook Followers: 268,423
11. Knights: Instagram Followers: 138,000, Facebook Followers: 238,822
12. Raiders: Instagram Followers: 160,000, Facebook Followers: 200,150
13. Titans: Instagram Followers: 210,891, Facebook Followers: 138,000
14. Sharks: Instagram Followers: 150,000, Facebook Followers: 186,000
15. Sea Eagles: Instagram Followers: 131,000, Facebook Followers: 204,669
16. Dragons: Instagram Followers: 137,000, Facebook Followers: 193,171
17. Dolphins: Instagram Followers: 100,000, Facebook Followers: 110,000
The Cowboys again rank as having the strongest following compared to population with a following significantly larger than the population of Townsville. Well-loved in its surrounding region and often supported as a first or second team for the rest of Queensland, their footprint is mighty.
South Sydney’s heritage and cultural footprint unsurprisingly represents a region much bigger than just their region with a token Souths fan believed to be have been found at every major sporting event on earth and likely will be found on Mars when Elon makes landfall.
The Sharks and Sea Eagles gain representing some of the most parochially followed clubs in sports in Australia. The Storm, Warriors and Broncos, although heavyweight kings, fall to the bottom when we adjust to population.
1. Cowboys: Facebook 168%, Instagram 120%
2. Rabbitohs: Facebook 148%, Instagram 90%
3. Sharks: Facebook 81%, Instagram 65%
4. Sea Eagles: Facebook 77%, Instagram 50%
5. Panthers: Facebook 56%, Instagram 58%
6. Knights: Facebook 61%, Instagram 35%
7. Dragons: Facebook 47%, Instagram 33%
8. Raiders: Facebook 44%, Instagram 35%
9. Roosters: Facebook 39%, Instagram 34%
10. Bulldogs: Facebook 37%, Instagram 26%
11. Eels: Facebook 38%, Instagram 23%
12. Titans: Facebook 21%, Instagram 32%
13. Tigers: Facebook 30%, Instagram 17%
14. Broncos: Facebook 30%, Instagram 17%
15. Warriors: Facebook 28%, Instagram 18%
16. Dolphins: Facebook 20%, Instagram 18%
17. Storm: Facebook 11%, Instagram 7%
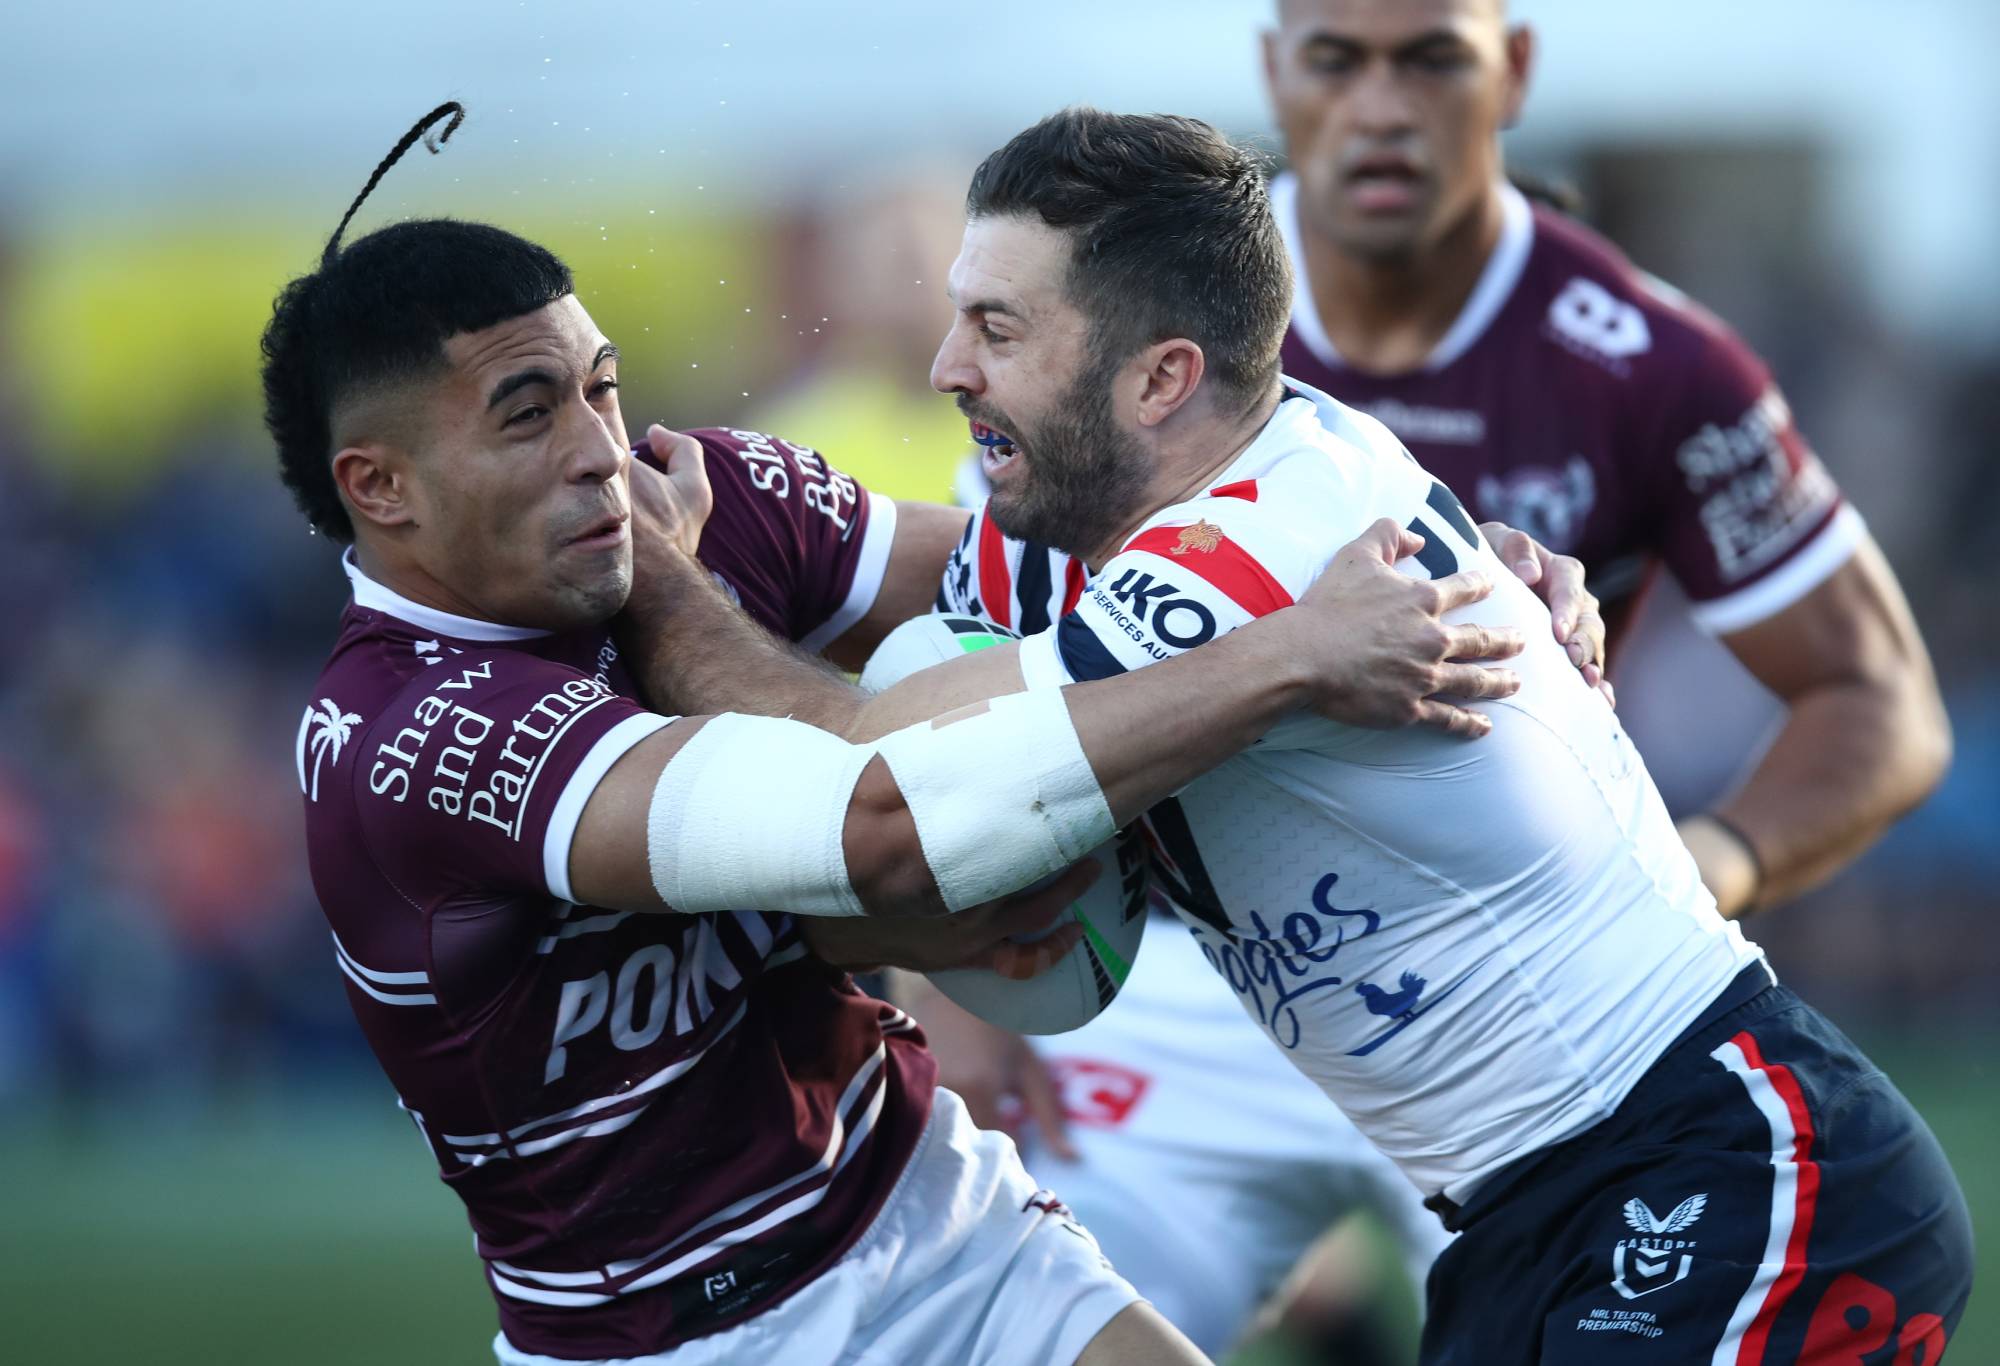
James Tedesco. (Photo by Jason McCawley/Getty Images)
Player Participation
Player participation was another challenge I searched high and low from annual reports to open sources to media articles.
NSW teams were mostly well available due to there being an arms race for players this is something clubs seemed to track more voraciously.
Queensland’s numbers are inflated as they adhere to broad QRL regions, so I had to then subtract what numbers I could find from the Dolphins and Titans from the Southern region.
The tricky part for Queensland is how many players from the Broncos and Cowboys actually come from regional Queensland areas outside of their proscribed location. As such the Cowboys numbers are exceedingly large a represent North Queensland as a whole.
Auckland unsurprisingly represented the largest pool of players, and this makes sense when we consider how many talented Kiwi-born and raised players end up finding a home across the competition.
The numbers I found (although please take them with a grain of salt) were:
1. Warriors: 20,588 registered male participants
2. Broncos: 17,001 registered male participants
3. Cowboys: 12,704 registered male participants
4. Panthers: 7,401 registered male participants
5. Titans: 6,500 registered male participants
6. Tigers: 4,626 registered male participants
7. Eels: 4,531 registered male participants
8. Knights: 4,339 registered male participants
9. Raiders: 4,266 registered male participants
10. Sharks: 3,478 registered male participants
11. Bulldogs: 2,944 registered male participants
12. Rabbitohs: 2,488 registered male participants
13. Sea Eagles: 2,461 registered male participants
14. Roosters: 1,860 registered male participants
15. Dragons: 1,675 registered male participants
16. Dolphins: 1,000 registered male participants
17. Storm: 700 registered male participants
Adjust for population and we get the Cowboys again topping the list (although inflated) followed by the men from the mountains, the lads from the Shire and the bros from Kiwiland to top off our “leaguiest” playing regions.
1. Cowboys: 6.5%
2. Panthers: 1.6%
3. Sharks: 1.5%
4. Warriors: 1.2%
5. Knights: 1.1%
6. Titans: 1.0%
7. Raiders: 0.9%
8. Sea Eagles: 0.9%
9. Broncos: 0.7%
10. Rabbitohs: 0.7%
11. Tigers: 0.5%
12. Eels: 0.5%
13. Dragons: 0.4%
14. Bulldogs: 0.4%
15. Roosters: 0.3%
16. Dolphins: 0.2%
17. Storm: 0.0%
(Photo by Mark Metcalfe/Getty Images)
Final Rankings
When aggregating all the above data we get the following scores:
Heavyweight Rankings of the NRL
1. Broncos
2. Eels
3. Rabbitohs
4. Roosters
5. Panthers
6. Storm
7. Bulldogs
8. Cowboys
9. Warriors
10. Dolphins
11. Raiders
12. Knights
13. Tigers
14. Titans
15. Dragons
16. Sea Eagles
17. Sharks
Unsurprisingly the Broncos establish their Tyson Fury status as the heavyweight kings of every single metric not factoring in population. Down south the Eels, Rabbitohs and Roosters hold statuses as the Usyk, Wilder and Joshua of the NRL.
When we adjust by population the boys from the North are without a doubt topped every metric proving themselves the most passionate, hardcore rugby league region maybe in the world…aside from maybe Papua New Guinea.
The Shark Shire folk’s stats were on the up and up per capita followed by the Manly men of the beaches.
The Raiders may not have got a mention previously but punch well above their weight when we average out all the results and the Novocastrians of Johnsland were right in the hunt.
While the Dolphins fall off in a few areas given time they have already proven themselves to be an absolute breakout success, punching well above their weight.
On the other hand, the Storm of AFL Melbtown, the Warriors of the Unionland of the Long White Cloud, the Titans of Surfie Town and the Donkeys of Bris Vegas who, while in many ways powerhouses in total numbers, fell off when we consider how big the regions that they represent actually were.
1. Cowboys
2. Sharks
3. Sea Eagles
4. Raiders
5. Knights
6. Rabbitohs
7. Panthers
8. Dragons
9. Dolphins
10. Eels
11. Roosters
12. Tigers
13. Bulldogs
14. Broncos
15. Titans
16. Warriors
17. Storm
Do these numbers surprise you? Let me know your thoughts.
Maxtruck
Roar Rookie
Suncorp is now "home ground" for Dolphins & Broncos, split it even when they both play ?
zonecadet
Roar Rookie
Not to mention going head to head with 70,000+ crowds at AFL games just over the road that one team often has to deal with.
zonecadet
Roar Rookie
I'm pretty sure it is.
Randy
Roar Rookie
I'm pretty sure thats not how the NRL factor in Magic round crowds....
The Barry
Roar Guru
Thanks mate… that was really interesting I don’t get the % of capacity metric. Isn’t capacity only relevant if grounds are sold out? Surely 30k in an 80k stadium is better than 11k in a 15k stadium, regardless of percentages Also, what about a success handicap… fans come out of the woodwork when a team is doing well and fade into the hedge when they’re battling. 15k attendance for a team coming 17th is surely better than 15k for a team in the top four in the passion stakes… ditto social media and memberships…?
Pickett
Roar Rookie
All good McChamp.
zonecadet
Roar Rookie
I have issues with the NRL's, and therefore your, attendance averages. How did you allocate the Magic Round Attendances? The NRL gives the total crowd figure to each 'home' team that weekend meaning, Bulldogs, Sea Eagles, Warriors, Sharks, Storm, Tigers, Roosters and Titans all got a 50,000+ home attendance, as did each 'visitor' that weekend. Take that out and get a clearer (although muddied further by games held up country and so on) picture of at least 5 Sydney clubs attendances, the five listed as home above.
Duncan Smith
Roar Guru
I haven't read the whole article yet, but a key difference in establishing a club is how popular the sport is in that region. So the Broncos in 1988 were guaranteed a huge fanbase from day one, but the Storm in 1998 a tiny niche audience in AFL land. It's obviously come a long way in 25 years, but still a minority sport in Melbourne.
Randy
Roar Rookie
if Redcliffe includes the Moreton Bay region then it would be massive. If it’s just the suburb of Redcliffe it might be small… that’s 700k people vs maybe 70k people
Maxtruck
Roar Rookie
Scheduling also skews the crowd numbers, Thursday night is a dud. And if you are taking you kids/grandkids arvo games are far more attractive than night games.
McTavish
Roar Rookie
Settle down champ, I'm no Roosters hater and not even from Sydney. More a dig at the underlying silliness that you can make judgments about how well supported a team is based on some sort of relationship between the population of historical and/or arbitrary geographic areas and game attendances/membership numbers. Plenty of other clubs have also dropped geographic references from their names because they know their supporters no longer all (or even mainly) come from that area, which invalidates the underlying premise of the article.
Simon SS
Roar Rookie
I didn't know I was paying more for my membership than Parra fans. The hat was ok this year. Scarf was a bit short haha
DP Schaefer
Roar Rookie
nice thoughts Pickett, but with respect to your kin, if the Roosters have a couple of bad years in a row, watch those numbers plummet. They are a well supported club - when winning. If you were down the bottom I seriously doubt you'd get numbers like Knights or Dogs do. But the future would be positive, you'd expect a big reaction for 2024, not a club that allows living out of the limelight for long.
Pickett
Roar Rookie
McTavish, Hang on. 99% of non-Roosters fans are indignant that we call ourselves 'Sydney', yet now when it suits your agenda to have a go at us, you want to call us Sydney. You can't have your cake and eat it champ. Haters will hate no matter what the facts/truths are. FTR, they are always Easts to 99% of oldish fans.
Pickett
Roar Rookie
I found this surprising as well. I’m also surpised by the small number of Redcliffe. I thought their junior base would be massive. It’s certainly massive in Gold Coast and they have no where near the history of Redcliffe.
Pickett
Roar Rookie
100% Dutski.
Pickett
Roar Rookie
Stu Thanks for your marvellous stats. It really shows that in all facets, Easts are doing very nicely. It clearly debunks the old 'no fans, no juniors, no soul' bunkem. And this is from a year where we are coming in the bottom 5.
Andrew01
Roar Rookie
Noted. I did have a look. But it seems to only cover the suburbs of Sydney. The Dragons cover Wollongong and given Kiama, Shellharbour etc are not any further from WIN Stadium than say the suburb of Kurrajong is from Penrith Stadium, that would seem to be a fundamental part of the catchment (and i am pretty sure Group 7 players play reps for Illawarra). Same with the Raiders. Their catchment goes beyond the borders of the ACT into country NSW. And if the Storm's catchment is all of Victoria, but the Bronco's are only a subset of south east QLD, there doesn't seem to be apples with apples with alot of these foot prints you are basing your data off of. And if you incorporate the Bears into Easts, then you have to do the same with Newtown into Cronulla. Wests Magpies are playing out of Lidcombe - their traditional home - but the map has that as Bulldogs territory? Not meaning to be a killjoy, I just think you need to look at how you set your baseline. Maybe a radius around a clubs home ground(s)? Though that would throw up its own inconsistencies as well probably.
Rugby stu
Roar Pro
Yes the regions were more literal and historical based but otherwise they become more debateable and abstract.
Rugby stu
Roar Pro
Yes it is difficult and based on 2023 snapshot data for recency. Yes support will fluctuate and because if this I provided a few different measures. The numbers are what they are.