The NRL, as every punter knows, very hard to predict. But is it impossible?
As legendary commentator Ray French was wont to say, you never know which way the rugby league ball is going to bounce, but a sound judge could give you a decent read on it. There’s the flight of the kick, the amount of spin, the distance it has travelled.
The game itself is a little like that. While what has happened in the past is not a guarantee of what will happen in the future, it’s certainly a guideline. These things are not as random as they look.
Certainly those with stakes in the game don’t think it’s unpredictable. The whole sport is geared around gambling, and betting firms certainly think that you can predict results. They’ve based a whole business model on it, and bult programmes to help them better understand the data.
Clubs, too, think that there’s a greater depth to be had. The good ones employ data scientists to build models that can help the coaches to get a read on performances that goes a lot deeper than simply who won the game.
The Roar does too. Readers with long-ish memories will remember the xLadder, and that’s where we’re heading now, with a new and updated predictive model that should be able to set us up the rest of the season.
This is the version 2.0 of our in-house model for the NRL, building on the work done here, but it’s worth going over the groundwork again before we get to the conclusions.
Here’s the elevator pitch: the model takes the stats that are best correlated with a positive margin – aka winning, and by how much – and uses them to generate a split of the two available competition points, which can then be arranged into a Expected Ladder (xLadder for short) that can then be compared to the real NRL ladder to work out which teams are over or under-performing their statistical output.
There’s a few differences between this model and the previous one – not least that v1.0 was made after the fact, which does make predicting easier. This time, we’re predicting before the events have happened, with a better model too.

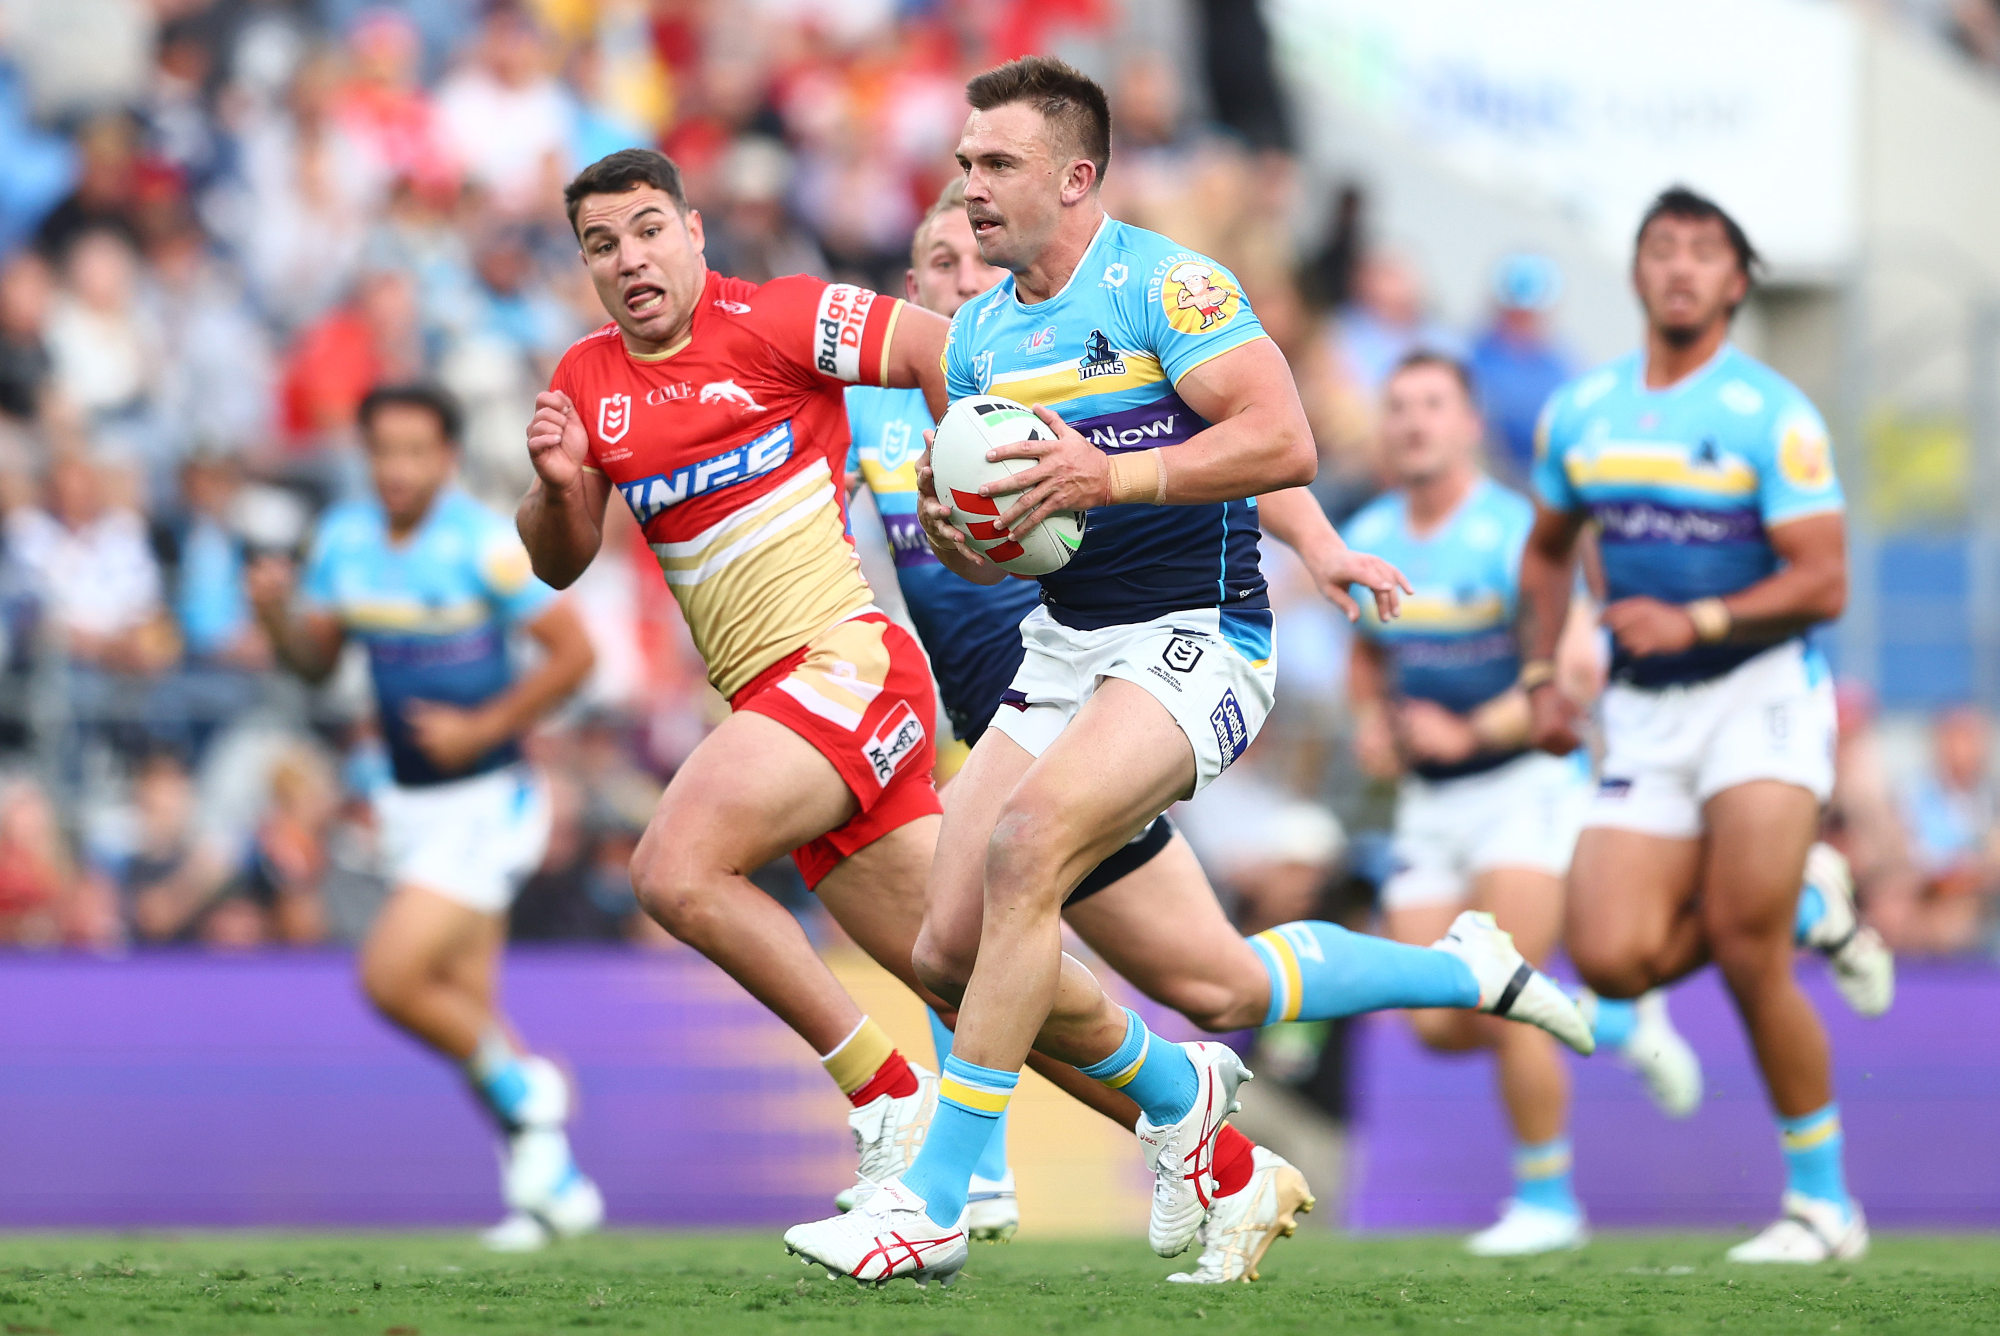
GOLD COAST, AUSTRALIA – JULY 09: Chris Randall of the Titans makes a break during the round 19 NRL match between Gold Coast Titans and St George Illawarra Dragons at Cbus Super Stadium on July 09, 2023 in Gold Coast, Australia. (Photo by Chris Hyde/Getty Images)
Version 1 took the end differentials between two teams in each NRL game of the 2022 season in the following four categories: run metres, total sets, line breaks and tackles inside 20 (T20).
In the design of version 2.0, more categories were integrated to test the model, with completion rates and tackles in opposition half (T50) also tracked and tested.
The testing is a whole heap of linear regression modelling that is largely too boring to list, but the upshot for the model is two-fold.
First, we can totally disregard completion rates. They are, at best, weakly correlated to winning and anyone who mentions them as an important stat should be immediately disregarded from talking about statistics in rugby league.
They only matter at all insofar as hitting a floor of 75%, beneath which it becomes harder to win, and beyond the semi-interesting fact that the floor has risen slightly year-on-year, that’s about all there is to say. Teams regularly complete high and lose, or complete low and win.
Our other data change involves red zone attack (T20), which was included but was considered the least important of the four key metrics.
This time around, we have replaced T20 with T50, conscious that good defensive teams are not bothered about defending on their line and that, in fact, the better attacking teams often are undervalued by red zone tackles because they score either from outside of the 20m or quickly within it.
The theory, then, would be that T50 should better reflect the general territorial balance of a game more than T20, which can actually reflect a team’s inefficiency with the ball rather than their ability to dominate field position.
The regression agrees with this. Including T50 improves the model, as does including T20 and T50, albeit not by much, whereas solely including T20 does not. Without going too deep into the weeds, the T20 stat is the one that matters least.

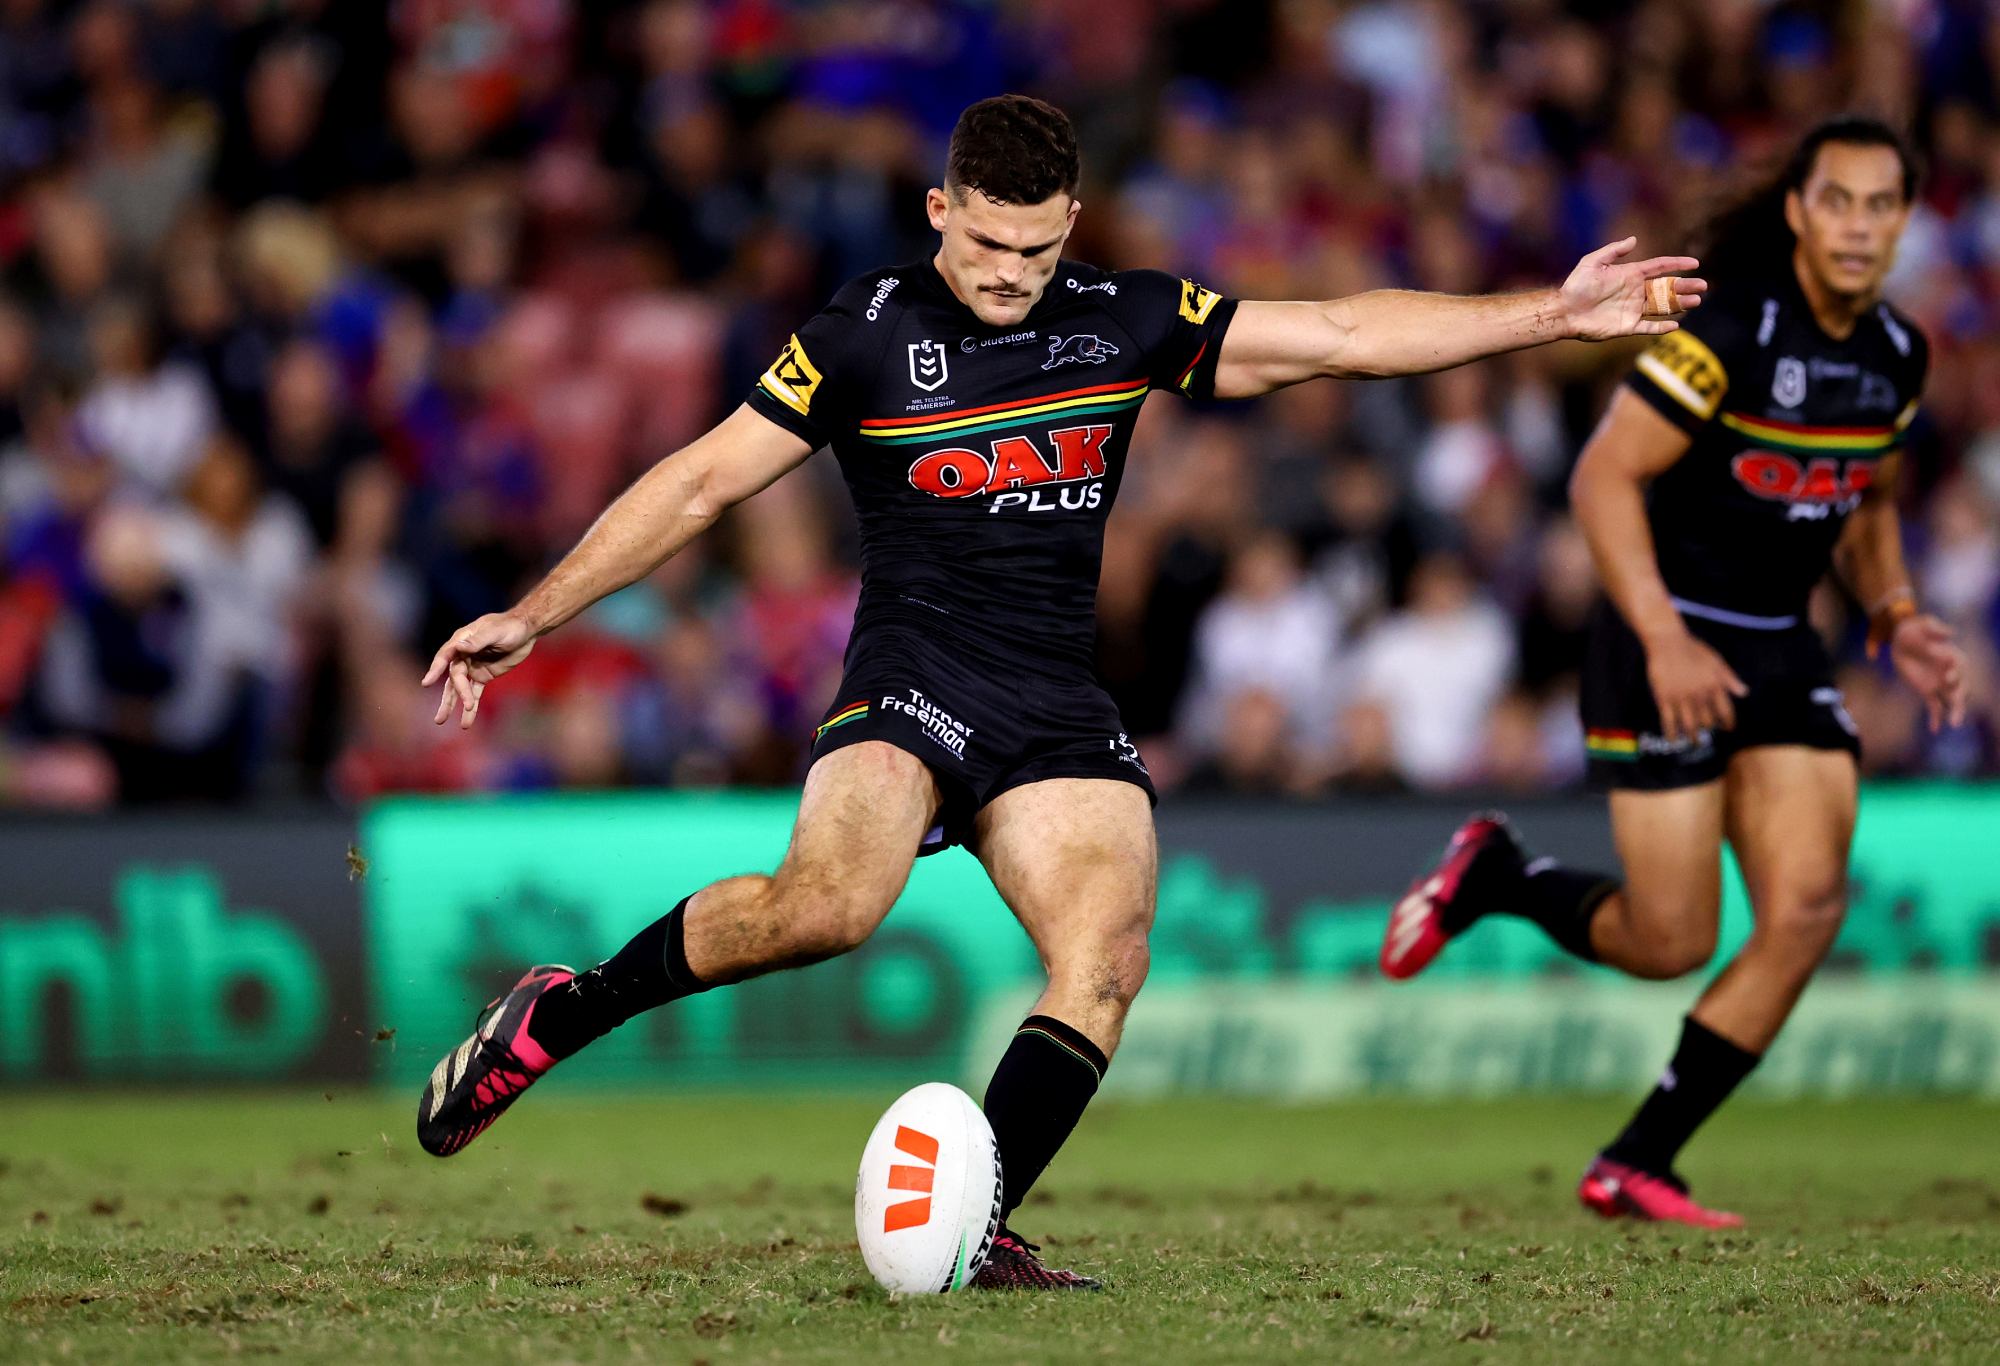
Nathan Cleary kicks the winning field goal in golden point to beat Newcastle. (Photo by Brendon Thorne/Getty Images)
The other major improvement on model v1.0 is a change in weighting that better reflects how much each variable matters: that means run metres are valued most highly, then sets, then line breaks, then T50.
There are also a few minor changes that are worth flagging too. With the addition of the 17th team, the Dolphins, we can’t do a traditional ladder until the end of the year given the uneven amount of bye rounds, so we are judging all teams on a points per game basis to allow easier comparison.
Last year, we also disregarded Golden Point in the xLadder, but used it in the real ladder: that has now been equalised and Golden Point (and the one draw) are in.
Theoretically, this model should be better sourced – it has twice the sample size of the last one – and more nuanced, with a wider range of outputs available. So what does it say?
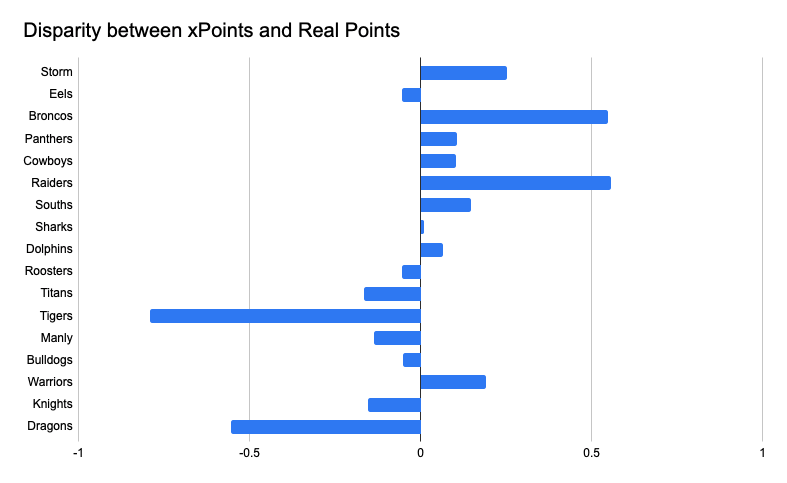
Well, it can already do something of a victory lap.
It ran this season from the start to Round 10, and from that, predicted the strong recent form of the Cowboys and Parramatta, both of whom it thought were undervalued after ten fixtures. They have both gone 6-2 since.
Similarly, it thought the Titans and Dolphins were a little overperforming, and we have seen them regress from where they were post-Round 10.
The Tigers remain the most underperforming team in the comp, but that will surprise nobody: they are, statistically at least, doing all the right things, but lack the polish to actually post points.
Of the five most statistically unlikely losses of the year, three are the Tigers: against the Eels, Raiders and Titans.
On the other end, it’s also probably not that much of a shock that the Raiders are overperforming, as they so consistently win close games. Probably would suggest that a team winning ten games by fewer than ten points is unlikely.
The model can only give between 0 and 2 points, and real life can only give 0 or 2, so a knack of winning close games will distort things.

Of course, the point would be that a ‘knack’ of winning in tight situations is unsustainable, which is the whole goal of the model. It expects Canberra to regress to the mean. Time will tell if that happens.
The Broncos, too, are overperforming, which might worry their fans.
Last year’s model also showed overperformance and predicted that they would miss the finals, which, of course, they did. This year isn’t as stark, but it still suggests the Broncos are getting the rub of the green.
With both Canberra and Brisbane, it might be that there is a key difference between the stats and reality that plays in their favour: game state.
Both have halfbacks who are brilliant game managers, which has allowed them to get ahead and stay ahead. This passes the eye test of anyone who has watched the Raiders race in front, look like they’re about to give up a lead, but then win anyway.
Canberra are right up the top for kick metres and Brisbane are up there for kicks finding space, which are good proxies for game management.
As stats are counted across the full 80 minutes and are blind to the score as it develops during the game, the result can be that modelling thinks that the game was close, because the final stats say that it was, but in reality, one side was happy to sit on a lead, giving away metres and possession knowing that they have a buffer.
Previous modelling has shown that most games could be cut off at the hour mark and have the result still stand, even though there’s a full quarter to play. Game state is huge.
It’s also worth mentioning that the model counts line breaks as a proxy for creativity with the ball, but there are other ways to score.
Jamal Fogarty is top of kick try assists with ten and Adam Reynolds is right behind him on nine, while Reece Walsh has five. If you’re getting 20% of your tries from kicks, as the Broncos are, that’s going to skew the stats.
But it might not be unsustainable if you have exceptional exponents.
This is pretty common in all sports, because the best players are by definition outliers. Lionel Messi and Harry Kane have consistently made mincemeat of Expected Goals (xG) in soccer because they are a lot better at finishing than most other players.
Not many can hit a post-protector like Fogarty can, and it might well be that his attacking kicking is an outlier. Over in Super League, George Williams is still killing the kick try assist stats, proving that the Raiders’ recruitment department really knows what it is looking for.

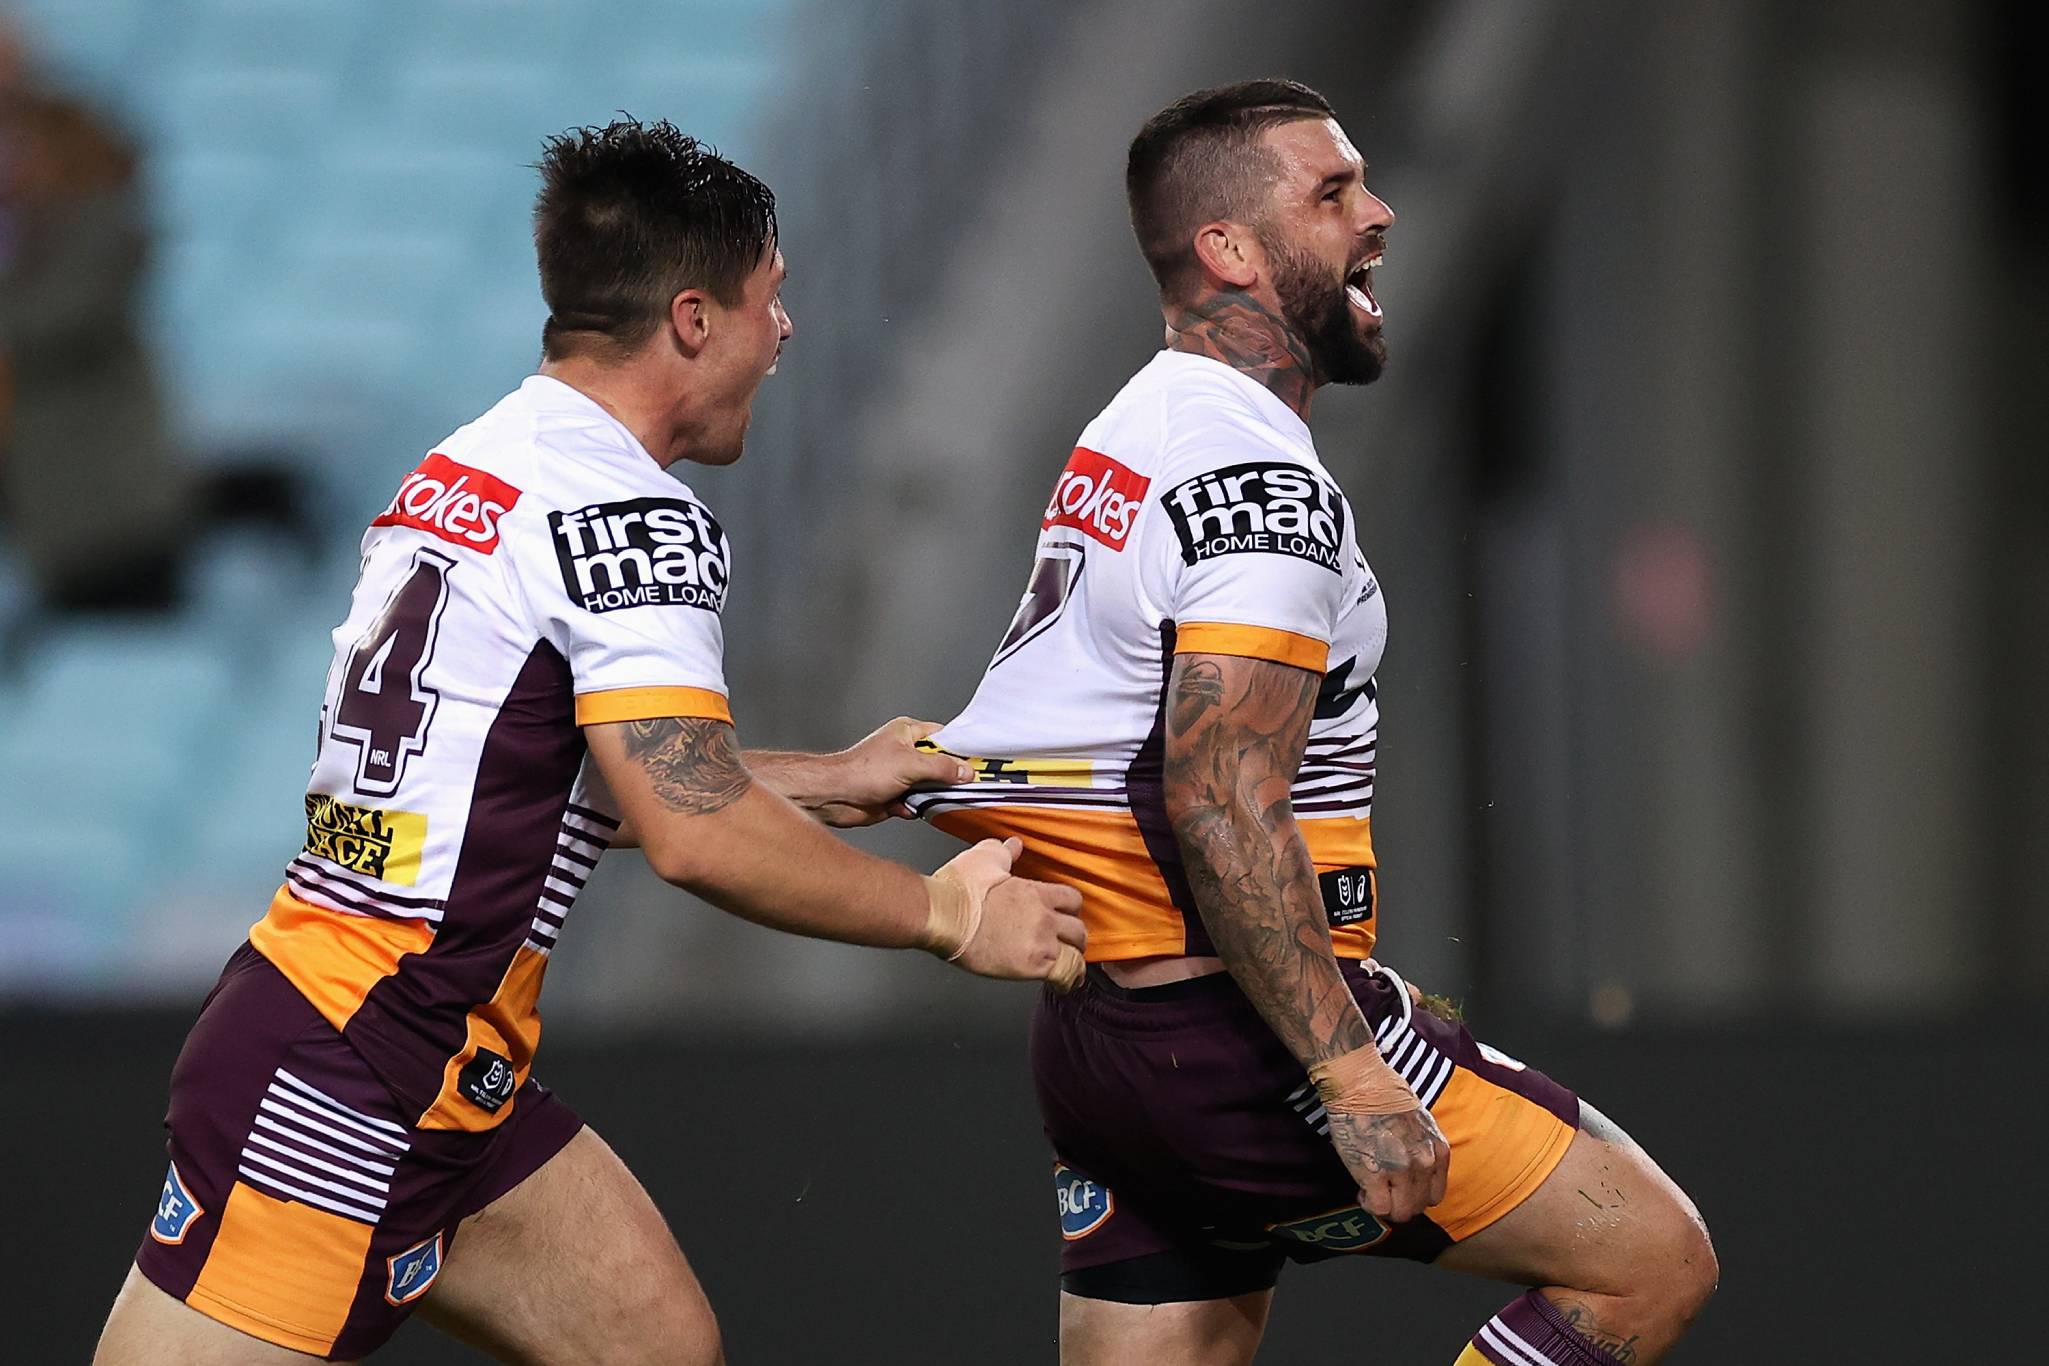
Adam Reynolds. (Photo by Cameron Spencer/Getty Images)
It might be that future models factor in kicking efficiency, but we’re not quite there yet.
The big test will come in the Finals. Last year, the model drew a clear line around the Sharks and suggested that they would go out in straight sets, which was ultimately what occurred.
The Raiders and Broncos would do well to take note, because if it isn’t skill and is luck, then that is likely to even out given the base stats that they are posting.
On the flipside, it is still bullish on Parramatta. The Eels are yet to fully regress to the mean and should have a bit further to go.
The model, obviously, can only give a probability guideline and can’t predict things like injuries, suspensions and coaching decisions, but it certainly thinks that if Parra keep doing what they are doing they will finish higher than where they currently are.
If you’re a punter – gamble responsibly, etc – then it might be of interest. The model thinks that Brisbane shouldn’t finish in the top four, which you can get $7.50 on right now at PlayUp.
It sounds ridiculous, but it sounded similarly ridiculous this time last year that they would miss the eight, and it was right.
Similarly, you’ll get $6.50 on the Raiders to miss the eight, which is a little less likely given the runs that they have on the board and the way the draw works.
It’s a fundamental drawback of the model – well, really, of the NRL – that the season only runs for 25 matches, rather than the 38 in the Premier League or the 82 in the NBA. It allows for luck to play an outsized role in proceedings. When there are a maximum of 50 points available, each two you can fluke are more valuable than they would be in other sports.
But an early Finals exit wouldn’t be surprising for Canberra, especially if they ran into one of the underperforming teams like Parra, the Cowboys or Souths.
The uneven strength of schedule also plays into this, as does the scheduling of Origin and the unequal way that players are drawn.
Souths losing – and, statistically, deserving to lose – ranks them lower than they would likely have been if they hadn’t been missing all their players, or indeed, if they hadn’t played 55% of their games against top eight teams, compared to 44% for the Broncos and 38% for the Raiders.
The stats reveal what has happened – but they can give you a guide towards what might happen in the future, too. As ever with predictions, only time will tell.
Tim Carter
Roar Pro
That's an indictment on the Challenge Cup.
mushi
Roar Guru
To nrl? In a way with the narrow box score (haven't followed hockey for a while assume it hasn't changed much) but they've also always kept the +/- and have the line shifts to create relevant data. NRLs problem is most of the stats they keep just don't mean much and so much happens off ball. Personally the best set up is probably has a total QBR style that looks at changes in expected points. Then attrtibutes those changes to different roles. The look at which roles seem to be more consistent. But that's why team wide ones can use the yardage etc as proxy's
Brett Allen
Roar Rookie
I suppose maybe then ice hockey would be the closest, especially modern hockey
The Barry
Roar Guru
Would times in the opposition 20 be any more reliable than tackles in oppo 20? What about successful times in oppo 20 over times in oppo 20?
mushi
Roar Guru
Soccer I’m less across other than knowing some guys who sold footage to well funded stats teams to create a completely different set of stats. If it’s those types of advanced metrics then they’re based on throwing lots of money at creating new data because the old stats were for pandering to confirmation. They also aren’t great for a true player level +/- or warp outside of a few positions.
The Barry
Roar Guru
You keep getting stuck on this Not long ago the complaint was that the NRL was very predictable was because not long ago the NRL was very predictable That complaint of not long ago was applicable to the period not long ago and was absolutely correct No one said it will stay that way forever You make that up so that your “prediction” of “Roosters and Storm won’t win forever” has anything resembling a meaning Going out in a limb and saying the Storm and Roosters won’t win forever isn’t a prediction… it’s blindingly obvious That you’d try to claim credit for such garbage as evidence of your nous says a lot about you - and little of it what you’d like Hit us with some more bold predictions oh wise one - who else won’t win forever…?
mushi
Roar Guru
I’d see basketball as the polar opposite. It has vastly superior stats, and has progressively improved upon them focusing on things which correlate to outcomes. It’s not a remotely comparable field position game. The win or lose of a possession is pretty clear cut which makes the modelling easier. And there’s positional importance. It’s no where near as rigid in basketball and it was shown more than a decade back at the Sloan sports conference that position of production isn’t important. Add that it’s 5 people and far easier to attribute their share of the aggregated production. That said they’ve acknowledged despite those advantages you really need to use 3-4 metrics to get a good handle.
Mike Meehall Wood
Editor
Two of Hull FC's 2016 Challenge Cup winners there my man, I will not accept these insults.
Tim Carter
Roar Pro
Manu Vatuvai, Fetuli Tanaloa, and Steve Michaels would feel dudded not to have that named after them instead.
Brett Allen
Roar Rookie
You mean like Isaiya Katoa ?
Brett Allen
Roar Rookie
But that’s also the case with other “flow” sports like basketball & soccer, and they’ve developed these sabremetrics to suit.
Red Rob
Roar Rookie
I won’t try to stop you :thumbup:
Panthers
Roar Rookie
That’s not like Parramatta at all. If his name is Ethan Sanders , they have a bit of an issue there! :laughing:
mushi
Roar Guru
Good stuff Mike. I think there is something in the finishing quality idea. Do the inside 20 conversion/ prevention rates have statistical significance on pts scored/conceded?
mushi
Roar Guru
I've never lost at anything, just been robbed by the officals a few thousand times!
mushi
Roar Guru
The issue for pythago and others is our stats aren't great to begin with let alone cross positional play comparisons. As you've found there's really only a few stats on a team aggregate basis that matter.
Redcap
Roar Guru
Well, most Eels have with only one or two notable exceptions. Hopgood's been brilliant. But there's another - word is he's rapidly becoming a cult figure - and he doesn't have any ties to Penrith that I know of. :shocked:
Redcap
Roar Guru
I resemble that remark. I try to make the world a stranger place everyday. :happy:
Red Rob
Roar Rookie
what can I say ... people are strange?
Mike Meehall Wood
Editor
No but League Eye Test does something like that, well worth looking up. PythagoNRL also has 'Wins Above Reserve Grade' too. I did once come up with one similar to NHL's +- stat that I called the Kenny-Dowall Number that contrasted how many tries you scored with how many were directly your fault...