The numbers game is back, despite one of the all time stinkers of a prediction flowing from our analysis this time last year. But don’t fret, because the guidance provided is a useful place to start our preseason proper.
For those who are new to this, this column looks at some of the numbers available for crunching and simply crunches them.
The facts below are presented without fear or favour, with minimal spin and maximum substance. There are some tricky concepts; please refer to the first run of this column in this form from 2016.
Housekeeping done, the miss was Richmond. The 2017 numbers game reckoned the Tigers were due for some further regression last year, given Richmond outperformed its Pythagorean win total by 2.2 wins. The Tigers finished 2016 on eight wins, and the formula said that was incredibly flattering: Richmond should have won 5.8 games.
Fortunately, I have been in this game a little while now, and cunningly planted an A-grade hedge around that Skunk Cabbage of a prediction:
The Tigers fell from 15 wins to eight last season, with some combination of poor strategy, lousy execution and lack of talent conspiring to wreck their season. I suspect the former two are more important than the latter, meaning Richmond and their coaching group have a chance to turn it around.
Indeed. Let this serve as a reminder that the below analysis is fallible. Taken with the right dose of levity it is a useful guide to the season ahead.
For example, last year’s numbers game was not kind to Hawthorn; the club promptly put up its worst win total since 2009. It also liked the Adelaide Crows, and did not like the Carlton Blues. It gave pause for thought regarding St Kilda, and was shouting about Port Adelaide’s potential for improvement when no one else would listen. Given that strike rate, it may pay to look a little closer at what we’re dredging up this year.
Pythagorean wins
The Big Mac of the numbers game, Pythagorean wins is a concept applied to sporting leagues the world over. It seeks to contextualise how a team performed over the course of a year, using points for and against. The formula determines whether the club earned more or less wins than it should have if there was no 22 game season, and wins were instead doled out based on a team’s strength over the year.
It’s useful to weed out teams which significantly over performed or under performed their capabilities. Last year, the formula said Richmond outperformed their win total by 2.2 wins, which is generally a mark of regression. By contrast, Adelaide underperformed by close to two wins, and although the club’s win total went backwards it finished first on the ladder.
Last year’s Pythagorean table was skewed by the Essendon saga – its final insult – given the return of the Dons was the mother of all out-of-model events. Essendon’s Pythagorean total from 2016 was 2.8, or 0.2 fewer wins than it collected; Essendon won 13 games last year. Given that, the system performed quite well.
What do the tea leaves say this year?
| Wins | Pythag Wins | Difference (+/-) | |
| Adelaide | 15.5 | 17.6 | -2.1 |
| Brisbane Lions | 5.0 | 4.4 | 0.6 |
| Carlton | 6.0 | 5.6 | 0.4 |
| Collingwood | 9.5 | 10.7 | -1.2 |
| Essendon | 13.0 | 12.5 | 0.5 |
| Fremantle | 8.0 | 4.7 | 3.3 |
| Geelong | 15.5 | 14.7 | 0.8 |
| Gold Coast | 6.0 | 4.9 | 1.1 |
| Greater Western Sydney | 15.0 | 14.2 | 0.8 |
| Hawthorn | 10.5 | 8.6 | 1.9 |
| Melbourne | 12.0 | 12.2 | -0.2 |
| North Melbourne | 6.0 | 7.7 | -1.7 |
| Port Adelaide | 14.0 | 16.6 | -2.6 |
| Richmond | 15.0 | 14.8 | 0.2 |
| StKilda | 11.0 | 10.2 | 0.8 |
| Sydney | 14.0 | 16.2 | -2.2 |
| WCE | 12.0 | 12.3 | -0.3 |
| Western Bulldogs | 11.0 | 10.2 | 0.8 |
Adelaide underperformed its Pythagorean win total for the second year in a row, garnering 15.5 wins against expectations of 17.6 wins. That level of outperformance would suggest all things being equal the Crows will be thereabouts the top four once again, and should challenge for the minor premiership.
The two other significant underperformers were Port Adelaide (-2.6 wins) and Sydney (-2.2 wins). Both can be explained quite rationally.
For the Power, their penchant for smacking the weaklings of the competition around meant the club accrued a bunch of excess margin in those games versus the rest of the league. That pumps up their season-long points for (and puts downward pressure on points against), leading to more Pythagorean wins.
By contrast, Sydney’s underperformance can be explained by its slow start: from Round 1 to 6, the Swans earned 2.2 Pythagorean wins but had no real life wins, where from Round 7 to the end of the year the club earned 14 Pythagorean wins, which was bang on its total.
Other underperformers included the mid-table Collingwood (-1.2 wins) and lower-table North Melbourne (-1.7 wins). The latter is particularly intriguing given there is a building consensus that the ‘Roos will finish in the bottom four once again in 2018.
At the other end of the spectrum, Fremantle absolutely obliterated its Pythagorean win total by 3.3 wins – the Dockers were the Adelaide of losing. According to the formula Fremantle’s performances were worth 4.7 wins, the second-lowest total in the league, where the club managed eight victories. This can be partially explained by Fremantle’s penchant for both close games (seven games decided by less than two goals) and blow outs (five games decided by more than the average margin plus one standard deviation – 56 points last year). All things being equal that would signal regression.
The only other significant outperformer was Hawthorn, which garnered 10.5 wins against expectations of 8.6 wins. There’s an element of Fremantle about this one – seven close games, three blow outs – but that doesn’t explain the whole lot. The Hawks simply outperformed, and on this analysis may find it hard to hold ground in 2018.


Close games
One explanation for a team under or outperforming its Pythagorean total is its performance in close games. Winning a bunch of close games – defined as a final margin of 12 points or less – will tend to result in a team outperforming its underlying potential, and vice versa.
That’s because close games are shown to be a coin flip over the long run. Few teams can continuously win games decided by two straight kicks. The one exception in recent times has been Geelong, which is currently sitting 10-2-1 in games with a margin of 12 points or less since the start of the 2015 season. The rest of the competition is 114-8-123 – which is to say basically a 50-50 proposition.
Geelong went through the full 2017 season without losing a close game – the closest the club came a draw against the Greater Western Sydney Giants in Round 15. As a result, the Cats won 2.5 games more than you would generally expect a team to win given how their season played out.
| Close Wins | Close Games | Difference (on 50-50) | |
| Adelaide | 1.5 | 3.0 | 0.0 |
| Brisbane Lions | 2.0 | 2.0 | 1.0 |
| Carlton | 3.0 | 6.0 | 0.0 |
| Collingwood | 2.5 | 6.0 | -0.5 |
| Essendon | 1.0 | 3.0 | -0.5 |
| Fremantle | 4.0 | 7.0 | 0.5 |
| Geelong | 5.5 | 6.0 | 2.5 |
| Gold Coast | 1.0 | 3.0 | -0.5 |
| Greater Western Sydney | 6.0 | 8.0 | 2.0 |
| Hawthorn | 4.5 | 7.0 | 1.0 |
| Melbourne | 3.0 | 6.0 | 0.0 |
| North Melbourne | 1.0 | 6.0 | -2.0 |
| Port Adelaide | 1.0 | 3.0 | -0.5 |
| Richmond | 1.0 | 5.0 | -1.5 |
| StKilda | 2.0 | 3.0 | 0.5 |
| Sydney | 3.0 | 6.0 | 0.0 |
| WCE | 3.0 | 9.0 | -1.5 |
| Western Bulldogs | 3.0 | 7.0 | -0.5 |
That Geelong has outperformed the maths for so long could suggest an even bigger crash in close games is coming. Equally, what’s to say there isn’t some kind of close game secret sauce Chris Scott has his players drinking?
The other team that had positive ledger in close games in 2017 was GWS. The Giants played eight games with tight margins, winning five and drawing two others. That yields six wins from eight tries, or an excess of two, suggesting a decline is in prospect. However, an unknown variable with the new kids is injury luck, and the role the club’s lack of it played in its 2017 campaign.
On the other side of the coin sit North Melbourne (one win from six close games), Richmond (one win from five), and West Coast (three from nine). The Roos had a close game deficit of two games, while the Tigers and Eagles were 1.5 games in the red. If that snaps back in 2018, we would expect the trio to get a boost to their respective win totals relative to their underlying performances.

Blow outs
The inverse of the close game is the blow out: games with a margin equal to the average margin plus one standard deviation. Setting it this way means the top 15 to 20 per cent of games are considered blow out results, depending on the exact distribution of scoring.
Last season, a margin had to reach 57 points to constitute a blow out result, down from 67 points in 2016 and 66 points in 2015. 34 games met that threshold; if the points threshold from 2016 had applied there would have been just 23 games push into blow out territory. It was a fairly tight season after all.
Blow outs are an important metric, because all things being equal, putting up margin is a solid indicator of a team’s ability, but a win is a win no matter the margin. So, a team that registers a lot of blow-out wins is probably better than its win total, and a team that registers blow out losses is probably worse. You can generally pick the team that finished on top in both categories if you think about it for a few seconds.
| Blown Out | Blow Out | |
| Adelaide | 1 | 8 |
| Brisbane Lions | 5 | 2 |
| Carlton | 3 | 0 |
| Collingwood | 0 | 0 |
| Essendon | 1 | 3 |
| Fremantle | 5 | 0 |
| Geelong | 0 | 3 |
| Gold Coast | 6 | 1 |
| Greater Western Sydney | 0 | 2 |
| Hawthorn | 3 | 0 |
| Melbourne | 0 | 1 |
| North Melbourne | 1 | 1 |
| Port Adelaide | 2 | 6 |
| Richmond | 2 | 1 |
| StKilda | 2 | 2 |
| Sydney | 0 | 3 |
| WCE | 1 | 1 |
| Western Bulldogs | 2 | 0 |
Adelaide led the way in blow-out wins, racking up a quite stunning eight of the things in 2017. What’s more impressive is they recorded three of those blow outs against their peers in the top eight – the rest of the competition did it four times (Essendon twice, North Melbourne once, and St Kilda once – go figure).
The other team to drop the hammer in its wins was Port Adelaide, blowing out six opponents (albeit none of them top-eight opponents). Essendon, Geelong and Sydney did it three times. The Dons are the interesting case here; the club’s flair for fast counter attacking football overwhelming West Coast, Port Adelaide and St Kilda throughout the year. Theirs is an interesting platform to build on starting this season.
Going the other way, Gold Coast (six), Brisbane (five) and Fremantle (five) were the whipping boys of the competition. The Lions attempted to square the ledger, blowing out the Dockers and Suns for two of their five victories. Here’s a little titbit: two of Brisbane’s other three victories were in close games, while their final win came with a score that was just under the average of the season (30 points).
Finally, Collingwood had no blow out losses, but also couldn’t manage a blow out win. It’s quite a rare feat: the last team to do that was the Western Bulldogs in 2016, while no club did it in 2015. One of these teams won a premiership while straddling the margin line, and the other did not.


Fixture change
Finally, we can look briefly at whether any teams are expected to see a significant ramp up or down in their respective fixture difficulty. We do this by taking the average Pythagorean win percentage of a team’s opponents, rather than wins and losses, for reasons we’ve discussed above.
This is a useful guide, but as it’s based solely on last season’s results it is not rock solid. By way of example, here is what each team’s 2017 fixture projected like last preseason versus how it actually turned out.
| 2017 (Projected) | 2017 (Actual) | Projected Rank | Actual Rank | |
| Adelaide | 49.1% | 50.6% | 12 | 8 |
| Brisbane Lions | 48.7% | 52.2% | 15 | 4 |
| Carlton | 48.4% | 52.3% | 16 | 3 |
| Collingwood | 50.8% | 52.0% | 6 | 6 |
| Essendon | 48.7% | 47.2% | 14 | 17 |
| Fremantle | 51.3% | 52.7% | 5 | 1 |
| Geelong | 50.6% | 49.4% | 7 | 11 |
| Gold Coast | 49.5% | 48.8% | 11 | 13 |
| Greater Western Sydney | 52.3% | 52.1% | 1 | 5 |
| Hawthorn | 52.3% | 52.4% | 2 | 2 |
| Melbourne | 50.2% | 49.1% | 8 | 12 |
| North Melbourne | 47.5% | 48.0% | 18 | 14 |
| Port Adelaide | 49.0% | 47.8% | 13 | 15 |
| Richmond | 48.1% | 45.9% | 17 | 18 |
| StKilda | 52.0% | 51.8% | 3 | 7 |
| Sydney | 50.0% | 47.6% | 9 | 16 |
| WCE | 49.6% | 49.9% | 10 | 10 |
| Western Bulldogs | 52.0% | 50.1% | 4 | 9 |
Most clubs stay within reasonable distance of their preseason estimates, but others don’t. For instance, Carlton was projected to have the third least difficult fixture – it became the third most difficult once the results rolled in.
Here’s how 2018 is looking now, compared to how last year played out.
| 2017 (Actual) | 2018 (Projected) | Change | |
| Adelaide | 50.6% | 50.4% | -0.5% |
| Brisbane Lions | 52.2% | 49.5% | -5.1% |
| Carlton | 52.3% | 49.7% | -4.9% |
| Collingwood | 52.0% | 47.4% | -9.0% |
| Essendon | 47.2% | 49.8% | 5.4% |
| Fremantle | 52.7% | 51.9% | -1.7% |
| Geelong | 49.4% | 49.6% | 0.4% |
| Gold Coast | 48.8% | 49.1% | 0.7% |
| Greater Western Sydney | 52.1% | 50.5% | -3.0% |
| Hawthorn | 52.4% | 51.1% | -2.4% |
| Melbourne | 49.1% | 50.3% | 2.4% |
| North Melbourne | 48.0% | 48.8% | 1.6% |
| Port Adelaide | 47.8% | 49.3% | 3.2% |
| Richmond | 45.9% | 51.4% | 11.9% |
| StKilda | 51.8% | 50.7% | -2.3% |
| Sydney | 47.6% | 49.4% | 3.8% |
| WCE | 49.9% | 51.2% | 2.5% |
| Western Bulldogs | 50.1% | 50.0% | -0.2% |
Most clubs bounce around about the same mark – everyone has to play everyone else at least once so this is ultimately a function of the double up opponents. Richmond’s fixture difficult ramps up significantly though, from the least difficult to the second most difficult, a fate which befalls most premiers.
Essendon has also seen its fixture difficult ramp up, but from a low base (17th to 10th). West Coast begin a new era with a tricky fixture, albeit one that’s not hugely more challenging than their 2017 slate turned out to be.
Fremantle has somehow once again been lumped with the most difficult fixture in the league, after their fifth ranked fixture evolved into the most difficult in 2017. That is likely a result of the Pythagorean wins formula rating Collingwood, Essendon and Port Adelaide higher than their respective win totals would suggest.
At the other end of the spectrum, Collingwood has been granted a kind slate of games, and the least difficult fixture in the competition. The Pies face an average opponent with a Pythagorean win total of 47.4 per cent, almost 1.5 points weaker than 17th ranked North Melbourne.
So… what?
That’s a lot of numbers. It’s difficult to draw definitive conclusions based on this alone – if it was easy my work for the year would be done – but we can glean some insights. Here is each team’s results from each of the four categories, and an assessment of whether it suggests good, bad or neutral news for the team in 2018.
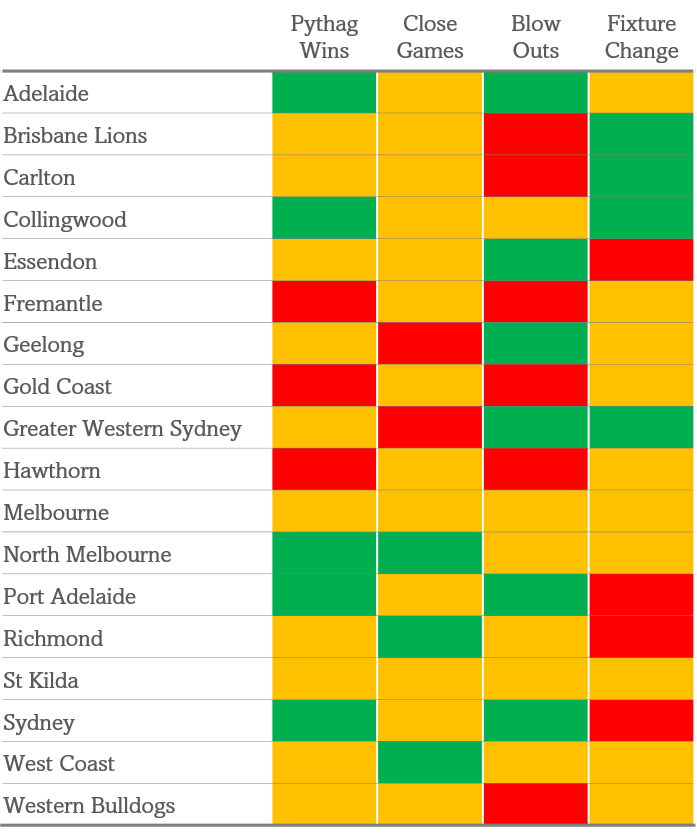

Adelaide, Collingwood and North Melbourne have a net two positive indicators heading into the year, suggesting they could improve their respective win totals. By contrast, Fremantle, Gold Coast and Hawthorn each have a net two negative indicators. They could be the candidates for regression.
But then, Richmond showed universal regression signs last year, and won the whole thing.
Now the scene is set, let’s dig a little deeper and see if we can’t find this year’s brightest prospects.
anon
Roar Pro
Not looking good for Rossy. Didn't he promise a premiership by 2020. Said he had no excuses for not delivering one. Recruiters at Fremantle have had two incredible offseasons back to back. Time to show what you're made of.
michael
Guest
Never read so much hog wash in my life for a start he has Richmond fourth at the end of the season no way that is going to happen the worst team to get lucky and fluke a flag I have ever seen
Macca
Guest
Its the draw that should have you most worried Josh, Last year you draw was much easier than Carlton, Brisbane or Freo.
Josh
Expert
Might not be a completely awful year to be a North fan if the numbers are anything to go by... a comparison of our blowouts vs other bottom four teams is particularly encouraging. Close wins not so much!
Gaz
Guest
Ryan Buckland's article on the numbers game is fascinating and, at times, satisfyingly arcane. You haven't been dipping into any theoretical stuff on sociological networks & hierarchies have you, Ryan? A couple of comments. The problem with numbers is that they can be dimensionless - 'Reynold's numbers.' So, when you are dealing with Port Adelaide, you have to assess how delusional they are about the meaning of their own history. When you are dealing with Fremantle, you have to remember that the coach has odd expectations ... etc.
Bangkokpussey
Roar Rookie
I think think pythagorean numbers are as useful as an ash tray on a motorbike. You can crunch numbers in anyway you want and come up with reasonably accurate statistics. If you look at the round 10 ladder for the last ten years there is a good chance that most of the final 8 has been decided. 3 of the top 4 teams will be in the top 4 at seasons end and 6 of the top 8 will be in the final 8 at the end of the year. If you look at the remaining 10 teams at round 10 only 2 teams on average will reach the "8" from there. The exception is that unexpected late season bolter that finishes much higher up the ladder into the final 8 than would have been expected,or the team that falls off in the latter half of the season due to injuries. Sydney was an example of poor early season form last year and were at 15th on the ladder in round 10 but managed to finish 6th. Conversely if your team is in the bottom 8 by round ten you are almost assured of missing the final 8.
truetigerfan
Guest
. . . until 2019 that is.
Peppsy
Roar Guru
Ryan I don’t know what’s going on with the % change on the fixture table, but it all seems wrong. On another note, you’ve put Hawthorn up as a team that outperformed this year and will likely slide, but isn’t it just as likely that it under performance in the first half, which pulled its expected performance down so much that the second half seemed like a severe over performance, when it was actually just their standard performance? Performance performance, permformance performance performance, perfmance.
Ryan Buckland
Expert
What exactly is rubbish about it?
truetigerfan
Guest
Brodie Smith? Won't offer much on field in 2019!
truetigerfan
Guest
Good one, Rick! You also have Freo and Collingwood making the 8. Seriously?!?!
Redb
Roar Guru
I think Adelaide are busted, Might make the Top 4 but mentally the team is gorn. New coach, new A list players required.
rod
Guest
My God! What a load of rubbish As much is said about the modern player being a robot, the truth is that humans run on emotion not programmes.
Jakarta Fan
Roar Rookie
Larry1950, the above ladder etc was the actual ladder for 2017 with the actual 2017 pythag predictions, not for this next season. 2018 is still a mystery and that's why I'm waiting to see Ryan's 2018 pythag predictions as I think that may be a better indicator as a basis for making our own 2018 predictions, which of course will factor in the recruitment success or otherwise, returnees from injury, aging of senior players etc.
Doc Disnick
Roar Guru
I think you'll find it's just the period we're in. I wrote an article many years ago about defense vs attack and how you're more likely to win with attacking football due to luck being taken out of the equation. Despite these two defensive teams winning the past two GFs, I don't believe either team will be able to maintain a dynsasty because of this. Just look at the Bulldogs... and I don't expect them back in the 8 this year either. The Tiges may well do the same thing and drop out of the 8. It really wouldn't surprise me at all, expecially with the pressure from the mid-tier teams.
Lroy
Guest
You nailed it... by seasons end the teams with the best for and against record will play off in the GF. Usually its the best defensive side against the best offensive side. Last couple of years with the Dogs and Tigers winning has put a bit of a spanner in the works for that theory, but I think its still a good yardstick. Crows should be right back in the mix, I expect the Eagles to surprise on the upside.. Eagles Crows GF might not be as far fetched as it first may seem.
Lroy
Guest
Interesting stuff. The Eagles winning 3/9 in the close ones was a surprise. I didnt realize it was so bad!! When you consider they will no longer have the two slowest players in the history of the AFL and a fit Nicnat will return I think they will be right amongst it in 2018. Win 6/9 of the close ones, Kennedy has a full seaon, Elliot Yeo has a breakout year as a midfielder then I reckon they will be on track to repeat their 2015 GF year. Dom Sheed has been unlucky with injuries last couple of seasons as well, would love to see him get a full season in as well, class act that guy. So, plenty to be excited about for Eagles fans, my only gripe is we should have had the 2018 side in 2016.
That A-League Fan
Roar Guru
Well Adelaide had lost Jake Lever and Charlie Cameron, two quality players. But they have a little bit of depth. I would most likely say: FB Rory Laird, Kyle Hartigan, Luke Brown HB Brodie Smith, Daniel Talia, Rory Atkins C David Mackay, Rory Sloane, Richard Douglas HF Tom Lynch, Taylor Walker, Riley Knight FF Eddie Betts, Mitch McGovern, Andy Otten F Sam Gibson, Sam Jacobs, Matt Crouch INT: Paul Seedsman, Jake Kelly, Wayne Milera, Josh Jenkins
Macca
Guest
Yeah I assumed it would have to be a project for the upcoming season.
Bobby
Guest
Woo! the annual "geelong will revert to the mean in close games" article. Been waiting on that since 2007 lol. Great article ryan