This time around we are going to look at our great spin bowlers and their performances in wins.
The minimum qualification is to have been involved in at least ten wins, plus to have taken at least two wickets per match (to remove part-timers). Please refer to my profile for a previous article outlining my approach and for articles that concentrated on our winning batsmen. For clarity, the Peer Difference Percentage I mention below compares an individual bowler’s performance in wins to their fellow bowlers in those same matches.
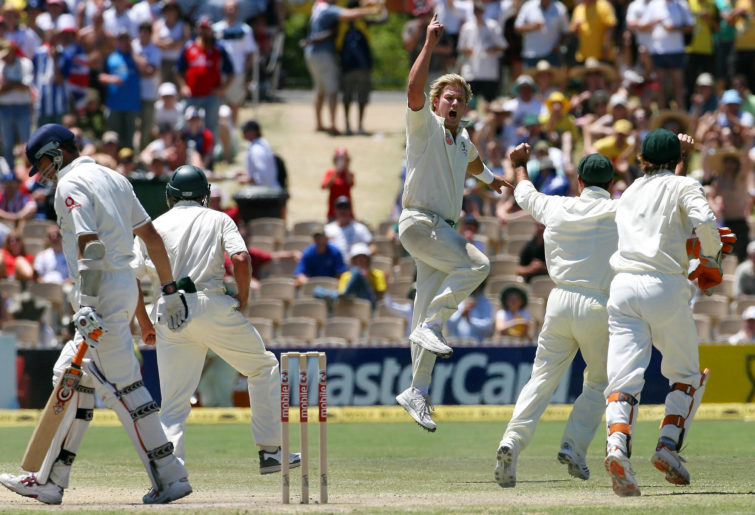
Shane Warne
92 wins (63.4 per cent of all matches), 26 losses and 27 draws. Wins average 22.47 (peer difference: +6.89 per cent). Wins wickets per match 5.54.
The great Shane Warne has featured in more wins for the Australian cricket team than any other bowler in history. On average Warne took over 5.5 wickets per match in wins and averaged under 22.5. These are excellent figures, especially considering spinners generally have a higher average than pace bowlers (due to a higher strike rate).
Warne’s average was nearly seven per cent better than all other bowlers in those matches, whatever their type. To the casual fan, 5.54 wickets per match might not seem a lot but it’s the seventh-best of all time for Australia. The bowler nearest to Warne on this mark is the great left-arm seamer Alan Davidson. Warne was a dominant contributor in wins. He took ten wickets in a match in victories seven times, which is the most in Australian history.
Warne’s competitive spirit can be seen in his performance in lost matches. A bowling average of 30.1 in losses was 13.1 per cent better than his peers. Both his bowling average and wickets per match (3.92) in losses are in the all-time top ten for Australia (ninth in each case). In draws, Warne’s average is also eight per cent better than his teammates and his 3.56 wickets per Test is eighth of all-time.
So win, lose or draw you could rely on Shane Warne.
Warne’s amazing accuracy was a significant factor contributing to his effectiveness. In wins, Warne’s economy rate was 5.3 per cent better than all other bowlers and in losses and draws this rose to above ten per cent. So even when the wickets weren’t coming to Warne was able to dry up the runs.

(Photo by Gareth Copley – PA Images/PA Images via Getty Images)
Bill O’Reilly
14 wins (51.9 per cent of all matches), eight losses and five draws. Wins average 14.95 (peer difference: +25.58 per cent). Wins wickets per match 6.5.
The player most often put up as Warne’s nearest competitor for the title of history’s greatest leg spinner is probably Bill ‘Tiger’ O’Reilly. And in winning performances it’s hard to argue against this.
In victories, O’Reilly’s bowling average of 14.95 is the best of all-time for Australia (minimum ten wins). His wickets per Test is only behind leg break partner Clarrie Grimmett and legendary pace bowler Dennis Lillee. When Australia won, O’Reilly took just under a third of the wickets to fall.
Interestingly if you consider how often O’Reilly and Grimmett played together, they took around two of every three wickets to fall in those matches – a deadly duo. In just 14 wins O’Reilly took five wickets in an innings nine times and ten wickets in a match on three occasions.
O’Reilly played in a very different era to Warne, as his winning economy rate of just 1.86 demonstrates, so let’s see how these marks compare to his peers at the time. O’Reilly’s bowling average in wins was a massive 25.6 per cent better than his teammates, compared to Warne’s 6.9 per cent. O’Reilly’s Peer Difference Percentage is the fourth-best of all time (minimum ten wins), so the comparison to his era brings him back a little, but only a very little.
Incidentally, the top three are 1960s underrated pace bowler Graham ‘Garth’ McKenzie, Alan Davidson and McGrath clone Stuart Clark, who will all feature in future articles.
So it’s O’Reilly by a knockout right? Well, let’s just check in on draws. In these matches O’Reilly’s average balloons to 30.88 per cent (compared to 14.95 per cent in wins). However, this is still nearly 41 per cent better than his peers in those matches and his 5.2 wickets per Test in draws is the best of all-time (minimum five draws). It certainly wasn’t Tiger’s fault that 20 wickets weren’t taken.
So, O’Reilly by a second knock-out.
Performances in losses tell a somewhat different story. O’Reilly’s average in losses was an unflattering 40.37 compared to Warne’s 30.09. His strike rate shoots up to a wicket every 134 balls (in wins it was 48.1 and in draws 77.5). However, O’Reilly’s legendary accuracy was still there and his economy rate of 1.8 means his overall bowling average in defeats was still nearly 20 per cent better than his peers.
That economy rate is the best by any Australian bowler in losses (minimum five matches). So even though O’Reilly was simply not a threat in those defeats he still kept things incredibly tight, making overcoming Australia very hard work.
Incidentally, the player with the closest bowling average in wins to O’Reilly is Alan Davidson (minimum ten wins), however, if you drop the qualification to five wins it’s 1970s leg spinner Jim Higgs.
We can all have our opinion on this and 92 career wins for Warne is certainly unmatched, however, these statistics appear to favour the Tiger.
But is there a third contender?
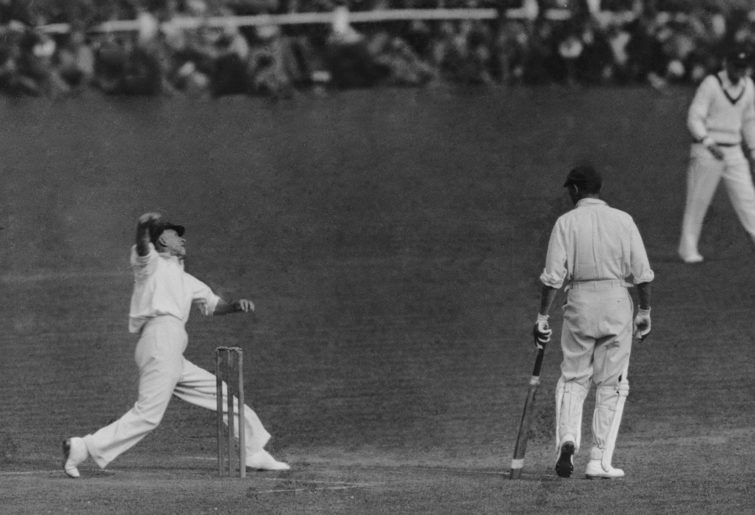
Clarrie Grimmett
20 wins (54.1 per cent of all matches), ten losses and seven draws. Wins average 17.6 (peer difference: +22.25 per cent). Wins wickets per match 7.15.
Clarrie Grimmett sometimes played in tandem with Bill O’Reilly and their contrasting styles proved to be very effective. Grum’s average in wins is fourth all-time but his 7.15 wickets per Test is the best in Australian history (minimum ten wins), taking well over a third of wickets to fall in wins. Grimmett’s strike rate and economy rate are both marginally behind O’Reilly’s so it appears he got those additional wickets per Test by the simple method of bowling more overs.
However the strike rate and economy rate were not too shabby, both being more than ten per cent better than his peers’ matches won.
In just 20 wins, Grimmett took five wickets in an innings 15 times and ten wickets in a match on six occasions. This latter mark is better by only Warne and also matched by Lillee.
In draws and losses, the pattern pretty much continues. Grimmett’s average is slightly behind O’Reilly in both cases, but it’s less than 0.5. O’Reilly had the better strike rate and wickets per Test in draws, but Grimmett took more wickets in losses, in fact, he took the second-most wickets per Test in defeats (minimum ten matches), only bettered by 19th-century bowler Charles ‘Terror’ Turner.
Grimmett’s Peer Difference Percentage for economy rate in draws of 19.6 per cent is also the best in history (minimum five draws).
So on these measures, it’s probably O’Reilly by a short nose, with Warne just maybe slipping to third, although he did win almost three times the matches of O’Reilly and Grimmett combined.
(Photo by Central Press/Getty Images)
The closest average to Grimmett’s in wins is turn of the century off-spinner Hugh Trumble and we will look at him below. If the qualification is dropped to five wins it’s bearded QLD workhorse Geoff Dymock.
Let’s a have a little look at some of our other great spinners over the years:
Richie Benaud
24 wins (38.7 per cent of all matches), 13 losses and 25 draws. Wins average 18.32 (peer difference: +12.81 per cent). Wins wickets per match 5.33.
Marvellous figures that. Benaud is comfortably in the all-time top ten for bowling average and wickets per match in wins (minimum ten matches). His Peer Difference Percentage in wins is very solid indeed, being almost double that of Shane Warne’s.
The legspinner had a similar level of performance in comparison to his fellow bowlers in draws, but surprisingly was frankly terrible in losses: an average of 43.03, which was a massive 36.6 per cent worse than his peers on those matches.
Benaud’s bowling average in wins sits comfortably between Dennis Lillee and early 20th-century captain Monty Noble.
Stuart MacGill
31 wins (70.5 per cent of all matches), six losses and seven draws. Wins average 24.4 (peer difference: +5.29 per cent). Wins wickets per match 5.32.
The long-time understudy to Shane Warne had a great winning record, emerging victorious over 70 per cent of the time. His average in wins was 5.29 per cent better than his peers (remembering Warne’s was 6.89 per cent). It is in wickets per match that MacGill excels, being tenth all-time just behind his great rival.
MacGill was poor in both losses and draws, so he possibly needed conditions in his favour to have an impact. His loss average was over 43 which is 18.5 per cent worse than his peers in those matches. He was 12.3 per cent worse than his fellow bowlers in draws.
MacGill’s bowling average in wins sits beside QLD perennial 12th man Andy Bichel. If we drop the qualification to five wins, then he sits just behind Doug ‘The Rug’ Bollinger.
Hugh Trumble
14 wins (43.8 per cent of all matches), 11 losses and seven draws. Wins average 18.0 (peer difference: +22.5 per cent). Wins wickets per match 5.50.
Hugh Trumble was probably our first truly great spin bowler. His Peer Difference Percentage in wins of 25.5 per cent is right up there and better than any other bowler in this analysis except O’Reilly. Trumble was also extremely economical, with his Peer Difference Percentage of 18.8 per cent being the best of all time (minimum ten wins).
Trumble’s 5.5 wickets per Test is virtually on par with Warne and sits eighth on Australia’s all-time list. This all points to a bowler who was very influential in Australian victories.
Trumble was just as good in losses. His average (third), strike rate (sixth) and wickets per Test (eighth) are all top ten. With a cut off of ten matches lost, only 19th-century star Charles ‘Terror’ Turner and Packer Years establishment lone wolf Rodney Hogg have better averages. Trumble was a very healthy 12 per cent better than his peers in defeats.
It was only in draws that Trumble comes back to the pack a bit with his bowling average being around four per cent worse than his peers in those matches.
Trumble’s bowling average in wins sits just behind Clarrie Grimmett. If we drop the qualification to five wins then he is right next to 50-over star finisher Michael Bevan.
Ashley Mallett
19 wins (50 per cent of all matches), ten losses and nine draws. Wins average 23.55 (peer difference: +0.3 per cent). Wins wickets per match 3.89.
The era between Benaud and Warne saw a number of spinners take their turn, with possibly none better than Ashley Mallett, who played on and off through much of the 1970s. Mallett had a bowling average in wins that was almost exactly the same as his peers, with a better economy rate offsetting a higher strike rate.
Together with slightly fewer wickets per Test than the other bowlers reviewed here, this implies that Mallett kept it tight to allow the Dennis Lillees of this world the opportunity to attack while still maintaining some threat. Mallett’s consistency is shown by his loss figures where his average and strike rate are seven per cent better than his fellow bowlers.
Mallett was not a wicket-taking threat in draws, averaging 44 which was nearly 30 per cent worse than his peers, but he still kept it tighter than the other bowlers in those matches.
The bowler nearest to Mallett’s wins bowling average is the follicly colourful Colin ‘Funky’ Miller.
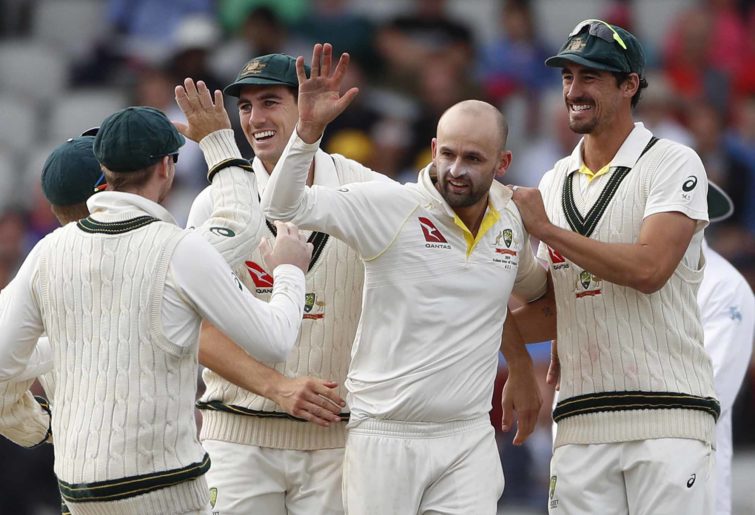
Nathan Lyon
51 wins (53.1 per cent of all matches), 29 losses and 16 draws. Wins average 26.41 (peer difference: -13.6 per cent). Wins wickets per match 4.37.
(AP Photo/Rui Vieira)
The GOAT himself. However, the only areas in victories where Lyon exceeds even Ashley Mallett is the actual number of Tests won (both in total and as a percentage of all matches) and for wickets per test, a healthy 4.37. Lyon’s winning average of 26.41 is more than 13 per cent worse than other bowlers in those same matches.
His economy rate is quite good, so this is all to do with strike rate. In wins Lyon strikes at 54.7 balls per wicket or once every nine overs or so. His peers in those matches strike at 47.77. So Lyon can take a while to build pressure or produce the wicket-taking ball. To be fair, three of his teammates, Mitchell Starc, Josh Hazlewood and Pat Cummins have historically brilliant strike rates, which skews the numbers a little against Lyon.
Lyon is no threat in draws with a bowling average approaching 50, although he keeps it four per cent tighter than the other bowlers.
However, in losses the GOAT stands up. His average, economy rate and strike rate are pretty much identical to the other bowlers in these matches. That doesn’t sound like much, but for a spinner, it’s very good. Lyon’s strike rate in losses of 62.7 is ninth-best in Australian history and his 4.21 wickets per Test ranks seventh.
Of all the great spinners, only Clarrie Grimmett took more wickets per Test in losses and only Hugh Trumble had a better strike rate.
So maybe he’s not quite the GOAT, but is nevertheless a worthy addition to our list of great spinners.
Sitting right next to Lyon in the list of bowling averages in wins is that cackling hyena of the airwaves, Kerry ‘Skull’ O’Keefe.
A final brief mention of some other interesting players. Arthur Mailey was a loopy legspinner from the 1920s. He believed that keeping it tight was a job for other players and it was his role to take wickets.
Which is why in wins his economy rate is a huge 40 per cent worse than the other bowlers in those matches, but he nabbed six wickets per test, bettered in all of Australian cricket history only by O’Reilly, Grimmett, McKenzie and Lillee. I’d call him the mega-MacGill.
Bert ‘Dainty’ Ironmonger only played in eight wins so he didn’t qualify for this analysis, but his average of just 10.07 in victories is unbelievable. A strike rate under 40 was combined with being the most economical Australian bowler of all time (giving up only 1.52 runs per over). Only two English bowlers who both ran around prior to WWI played in at least five wins with a lower bowling average.
Ironmonger’s average in losses was also ten per cent better than his peers, so he wasn’t just a turning track bully either.
Nest time we move to a selection of our greatest pace bowlers – the attack leaders.
Michael
Guest
I also thought so until I read a book called ‘Twirlymen’ ( great read). According to the author he reintroduced it after it had long been out of use.
Michael
Guest
Dwayne, Can’t agree with you more. It’s cricket not baseball.
sheek
Roar Guru
Stephen Wright, what’s with the personal attack? If you’re an expert on 1920s Aussie cricket, I’m happy to be corrected. The reality is the 1926 team was poorly selected, especially in pace bowling. And unlucky. Young Sam Everett was injured & took little part. Hendry was either ill or injured & restricted. Gregory was now on one leg & maybe shouldn’t have toured. This left Ryder as the only fit paceman, & he wasn’t a frontline bowler. Kelleway was omitted, but he was 40. Scott was 38. Wall had only just debuted at 21. So there weren’t many options. I’m always happy to bow to greater knowledge if you can provide it. But a cheap shot? No.
Stephen Wright
Guest
H'mmm Sheek- ...."left a lot to be desired"......is that compared to you, is it? Pity you weren't available then! LOL
Stephen Wright
Guest
Great article, Matt, puts our bowling past into perspective particularly in the context of our modern tweakers. Bloke by the name of Saunders, played only 14 tests, so doesn't probably fit in the "10 wins" category, but is worth a look. He bowled medium as well as slow. 79 wickets, not too shabby, what do you think?
Ryan Maximus
Guest
My favourite spinner of all time is Robert (Dutch) Holland. The West Indies batsmen were run ragged by Dutch in the 80’s, and I loved his genuine ‘gentleman’ of cricket reputation. He did so much to promote cricket and coach kids through his beloved home club in Newcastle NSW. RIP Dutchy, we all miss you.
Once Upon a Time on the Roar
Roar Guru
Matth I was just thinking you should count ties on both their winning and losing stats. A tie is not a draw because all 4 innings are completed before reaching ‘time’. It can feel like a win because you didn’t lose and can also feel like a loss because you didn’t win. So I think players performances in either of the tied tests should be factored into their stats in result tests.
sheek
Roar Guru
Matty, The 1920s belonged to batsman. Mailey's test average was 34, McDonald (who played at the beginning of the 20s) was 33, Gregory was 31, Hendry was 40 & Ryder 43. In 1926, along with Grimmett & the uncapped paceman Everett replacing McDonald, these were the frontline bowlers for Australia. To that list you could add the bitsa (bitsa spin, bitsa pace, bitsa batting) Arthur Richardson. Gregory, Hendry & Ryder as the pace attack, & Mailey, Grimmett & Richardson as the spin attack, left a lot to be desired.
matth
Roar Guru
Hi Sheek, Arthur Mailey got a mention right at the bottom. He took 6 wickets per test which is brilliant. 5th all time for Australia. He wasn’t interested in economy rate which affected his average, and he needed conditions in his favour.
badmanners
Roar Rookie
That may be the inspiration or it may be the ska band from the 80's... :thumbup:
sheek
Roar Guru
There's a cafe in Glebe called Badde Manors. Great name with a twist to both words.
sheek
Roar Guru
“So maybe he’s not quite the GOAT” is an accurate summation of Lyon. He’s lucky to have played so many tests, which helps his profile. Being ranked 10th here is about right. What about Arthur Mailey, what were his stats compared to these other guys? Mailey is often maligned because he himself often put himself down, which made it easier for others to do likewise. And also Bruce Yardley, who statistically is remarkably similar to Mallett. However, having said that, I’m perfectly comfortable with your rankings. Best leggies – Warne, O’Reilly, Grimmett, Benaud & MacGill (although on raw stats I would have thought MacGill better than Benaud). Plus, I would be interested in Mailey being judged by your criteria. Best offies – Trumble, Mallett, Lyon in that order. Maybe Yardley next. Cricket, along with baseball, are the two sports with a myriad of stats, which can be twisted & turned to suit one’s argument. Sometimes, having too many stats can be as bad as having too few!
Tempo
Roar Rookie
Might have to get used to it with the rise of women's cricket. "Batswoman" doesn't have much of a ring to it...
All day Roseville all day
Roar Guru
Thanks matth, clearly some spinners in teams with limited depth were key to wins and still had to bowl a lot in losses- Murali. In 54 wins, took 438 wkts at 16.18. In 42 losses, took 210 wkts at 31.66. In each loss still averaged 5 wickets, but bowled so much conceded 158 runs each time. Only 12 more wins than losses, but 228 extra wickets for those extra 12 matches. Averaged 8.11 wickets per win. Herath. In 38 wins, took 243 wkts at 18.83. In 34 losses, took 107 wkts at 44.00. Only 4 more wins than losses, but 136 extra wickets for those extra 4 matches. Averaged 6.39 wickets per win. After Murali's retirement, averaged 7.88 wickets per win in 26 wins. Kumble. In 43 wins, took 288 wkts at 18.75. In 33 losses, took 124 wkts at 41.35. Only 10 more wins than losses, but 164 extra wickets for those extra 10 matches. Averaged 6.70 wickets per win.
Jero
Roar Rookie
I recall MacGill when asked in an interview with Andrew Denton who was the better spinner, saying that by far and away Warne was. But in the right circumstances/conditions he could be as effective. He said he didn't begrudge his career colliding with Warne's, as he got to bowl with the greatest spinner ever. A pretty fair and gracious response.
matth
Roar Guru
Yes his bowling stats in tests weren't great. But he did feature in an earlier article. Taylor has the best batting average in losses of any Australian who played in more than one loss.
matth
Roar Guru
I would hose that down just a little. There are two reasons MacGill did better than Warne in those conditions: 1. In some Warne was in his way back from injury and not bowling well. West Indies 1999. 2. Often when two spinners are picked it’s because conditions are in their favour. MacGill was extremely good in those conditions. Warne’s genius was being great in mostly all conditions. When MacGill played on his own in conditions where only one spinner was selected he didn’t do as well as Warne. None of this is to denigrate MacGill. I included him in this article because he deserves to be considered one of our best.
Jero
Roar Rookie
I've always thought so. Had they picked him and not Tait for the last two Tests it could have made a big difference. Especially at Trent Bridge. It was asking a hell of a lot of Tait on debut, and MacGill was a genuine wicket taker. Tait leaked a lot of runs, and was barely used in the second innings. Just three more wickets....
Rowdy
Roar Rookie
Ponting would not know how to marshall or use them.
Micko
Roar Rookie
Imagine if we went picked him in the 2005 Ashes side instead of one of the fast bowlers?