The growth in fantasy gaming and online gambling in recent years, while not necessarily a good thing, has correlated with advances in statistical analysis and modelling in rugby league.
The same thing happened in American sport years ago.
Like American sporting franchises, NRL teams have their own data analysts and, one assumes, their own proprietary databases and performance metrics.
As a long-time baseball follower, I’m fascinated by advanced metrics like wins above replacement and fielding independent pitching.
Rugby league isn’t as advanced when it comes to statistical modelling and probably won’t ever be. It’s not just the later starting point. Baseball is structured, situational and very measurable. Rugby league, less so.
But there are some really good resources. I recommend Pythago NRL and Rugby League Eye Test for those not already familiar.
While I’m fascinated, I must admit that things like probability modelling and ELO ratings are a long way over my head.
I’ve never been good at maths. I make my living summarising written material for people who don’t have the time to read all of it.
I suspect advanced performance and probability metrics are unlikely to intrude on mainstream rugby league coverage in the foreseeable future – outside the gambling advertisements of course.
Perhaps we can find a middle ground between Bryan Fletcher and Pythago NRL? I mean no offence to Bryan Fletcher; I’m referring to his deliberately obtuse television persona.
The following is an NRL player value model by a maths dummy for other maths dummies.


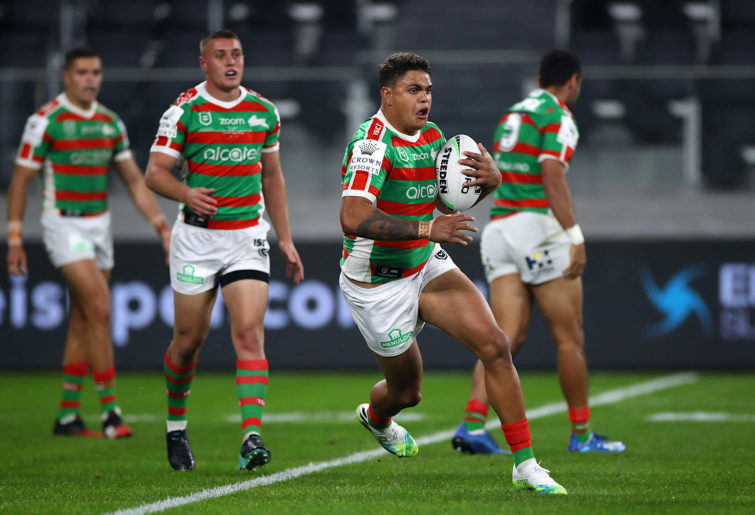
(Photo by Jason McCawley/Getty Images)
First, what am I not doing here? The methodology is sufficiently general to be applied to players across all positions but is not a means of comparing players in different positions – for obvious reasons.
Performance is a function of opportunity. Most middle forwards spend much less time on the field than other players. Wingers and fullbacks tend to operate in a lot more space than players in the middle. Spine players touch the ball more.
Somebody much smarter than me might be able to figure out how to make positional adjustments.
Kicking is excluded because not many players kick in general play and even fewer attempt conversions, penalty goals and field goals.
Stats Insider has developed a true kicker rating system that ranks goal kickers based on their overall success rate and the degree of difficulty they’ve encountered. I can’t improve on that.
So, what am I doing? I’m measuring the impact of NRL players based on three broad and interrelated measures. Through impact I capture much of a player’s value.
As mentioned, some aspects of performance have been excluded. There are also aspects – effort, decision-making and positioning, for example – that can’t be quantified.
The first measure of impact is engagement in the game. This involves calculating how many times a player runs the ball or attempts a tackle per minute of their playing time. This is then extrapolated to total engagement over 80 minutes, with errors, penalties and missed tackles deducted to reach a net positive engagement value.
What about players who only play 25 to 35 minutes at high intensity? Do you apply a greater weight to the performance of players who impact a game over more than 60 or 70 minutes? If so, where is the cut-off and what are the weightings?
I say it’s better to extrapolate the available sample over the same time frame and remember we’re comparing players within categories. It’s just an estimate of value, not an absolute measure.
The second measure of impact is facilitation: tackle busts, line breaks, offloads and try assists.
It’s here we meet the POPE: the proportion of positive engagement rating.
This is straightforward. It’s how many times a player facilitates a potential attacking play, with the POPE rating being a proportion of the player’s net positive engagement.
The third measure is finishing. Basically, tries. The finishing POPE rating is calculated the same way as the facilitation POPE rating.
The quality of a try can vary from a player catching the ball and falling over the line to something like Manly’s Reuben Garrick-inspired 110-metre odyssey against North Queensland.
Either way, the scorer of a try benefits from the facilitative work of others. Therefore, facilitation carries more weight than finishing. Each line break and try assist is worth 25 per cent more than other facilitation and finishing values.
(Photo by Mark Kolbe/Getty Images)
What does all this mean? All data is from the 2021 NRL season and sourced from the Fox Sports Lab.
Dally M Medal winner and all-round man of the moment Tom ‘Turbo’ Trbojevic has a POPE rating of 7.11 per cent. In other words, 7.11 per cent of his involvements have a significant impact on a game.
It’s not very catchy though. Here I borrow from the ingrained tendency of baseball fans to refer to percentages as whole numbers. For example, a player who gets on base 35 per cent of the time is verbally referred to as having an on-base percentage of 350.
I know it’s mathematically unsound, but we’re moving from the realm of math into that of popular culture.
Tommy Turbo is worth 711 POPEs.
In the realm of the very, very good is James Tedesco at 640 POPEs.
Further back, Ryan Papenhuyzen comes in at 472, with Clint Gutherson at 407.
If you were about to say, ‘I don’t need a spreadsheet to tell me that Turbo Tom’s the best,’ hold that thought.
Latrell Mitchell is worth a heavenly 731 POPEs, primarily because of his off-the-charts run metres per carry and because he makes fewer mistakes.
There are a couple of other things we can do with the POPE rating.
First, we can establish what constitutes a replacement-level player. At fullback in 2021 replacement level is somebody like Caleb Aekins or Blake Taaffe, who between them played 15 NRL games in 2021. The average of their combined performance is 254 POPEs.
Tom Trbojevic is therefore 65 per cent better than a replacement-level player.
Second, we can establish the opportunity cost of mistakes. This is expected POPE, or the x-POPE.
Tom Trbojevic’s 711 POPE rating could have been 721 had he not made any mistakes.
Penrith’s premiership-winning fullback Dylan Edwards is worth 290 POPEs, only just above replacement level. His x-POPE rating is 292. He might not make much impact with the ball, but he rarely makes mistakes.
I intend to do a few more pieces applying the POPE system in other ways. Any and all constructive feedback from Roar readers would be most welcome.
Gus O
Roar Rookie
Interesting… but i note the author’s own comment “There are also aspects – effort, decision-making and positioning, for example – that can’t be quantified.” These are areas that Tommy T and Billy Slater before him excelled. Their perpetual motion efforts from sideline to sideline in both attack and defence for the full 80 minutes are exceptional. If these three aspects cannot be directly quantified, then it is worth looking for a measurable surrogate indicator of these highly valuable performance attributes. How would Cameron Smith score in POPEs i wonder if positioning and decision making (particularly when game is on the line) are excluded from the analysis?
Redcap
Roar Guru
Thanks Nicko, POPE's not all that complicated - just a bit laborious. In some ways Earl Weaver was ahead of his time considering the way the game's played today. Three true outcomes and all that. I still like it, but it's not as good as it used to be when the ball was in play more. While Moneyball's ancient history, there are vague echoes in some of what teams have been up to in recent years. What-can-we-get-away-with-Ball. Looking at you Houston Astros (though they're probably all up to some kind of subterfuge).
Nick Maguire
Roar Rookie
AMG, thanks for taking this on, it's complicated! I am no maths genius either but I read and understood most of Moneyball and get annoyed at the misuse of that expression by those that didn't. I'm a Baseball player coach and follower for 40 years so the statistical analysis of that game doesn't phase me. The arcane sabermetrics are too much for me but WAR seems to make sense and the extension of that to valuing a player (or potential player) within an organisation (the A's in this case) for what they add to the bottom line was enlightening. I also loved how Moneyball disrupted the age old unwritten rules of Baseball, of which there are many, such as around "small ball". I suppose Earl Weaver was right all along - a hit, a walk and a 3 run homer! I think your POPE has merit if only for providing some sort of objective metric in discussions at the Pub! WAR is now in everyday fan use when discussing players and is often used to knock the subjective on the head with some data. Good luck fine tuning it and I look forward to more discussion around it. Cheers
mushi
Roar Guru
Ah but by that notion clearly people making unsystematic qualitative judgements can't do that either so then there isn't any point to anything... Or perhaps we can use learnings from one system to augment findings in others to make more, rather than deliberately less, informed decisions.
mushi
Roar Guru
Laterell should be Nixon given his time on the sidelines
mushi
Roar Guru
Defensive stats and tackles/missed tackles are an interesting one. The basic thought process is that if you made the tackle you are a good defender. Therefore if you make more of them, you’re a better tackler than someone who didn’t. But the part missing is that it’s normally the attack which decides who is going to attempt the tackle (NFL used to do this with defensive backs, people mentally ranked them by interceptions whilst smart teams realised intercepts happen because they threw your way, and they threw your way because they thought you had messed up – the better player was the one the QB didn’t bother trying to throw on). So often having a high tackle count is because the ball runners are targeting that player as the weakest link. Yes it’s still good that hooker’s make the 40+ tackles they’re asked to but the fact the opposition keep asking suggests they think he’s not the most effective defender in that part of the line. When you look at which stats really seem to matter its line breaks and field position surrendered (Metres conceded is even better if you subtract the defending teams kicking metres). This year linebreaks and the field position stats correlate at around 0.9 to points scored. Missed tackles just under 0.5 and tackles made even slighter rounding to 0.4. That is consistent with when I’ve looked at it before. So of neither of the actual two big contributors to defence are captured in the individual stats (except kicking metres but everyone thinks of the little half as a bad defender even though he’s the lynch pin – ergo Penrith = Premiers despite their attack going pop gun and missing a plethora of tackles in the finals) Now some missed tackles lead to line breaks but it’s obviously not consistent or they’d be equally as correlated with points allowed. Many of those missed tackles are from strong defensive forwards are as they come out of the line on other rampaging big guys and try to shut them down early. They’re a by product of line speed and just attempting early is more effective than a passive feet set tackle from the smaller player. Or they are from a scramble that is enough to shut down the movement. Missed reads in defence are the bigger no-no but it’s not something we seemingly keep unless people are slipping them into the missed tackle counts.
Tim Buck 3
Roar Rookie
Most Useless U.S. President : Woodrow Wilson
mushi
Roar Guru
and thus proving my point :)
Heyou
Roar Rookie
Reading these thread thingamajigs has my mind boggling re defence centric extrapolations and I have algebraic equations floating around in the grey matter. It’s a shame that none of it is coming together in any kind of meaningful way… I’m having a most interesting day. Please continue to do this intriguing work. I look forward to refinements and resulting discussions. :thumbup:
Tony
Roar Guru
Are you counting dropped balls?
Heyou
Roar Rookie
Now now.. I’m sure I saw him passing the ball a few time.
Heyou
Roar Rookie
I love Maths. I love statistics. It’s Monday morning and I’m waiting for the washing cycle to finish. I’m thrilled for my old brain to have Maths in relation to the great game to think about and ponder on. It will stick with me all day so thank you very much A. Mega Dragon. (I might get have to read it again later though)
Heyou
Roar Rookie
I like it. :laughing:
Big Daddy
Roar Rookie
Jimmmy, perhaps it was Lloyd. What are his stats like.
no one in particular
Roar Guru
yet no premiership to show for it
Redcap
Roar Guru
That's pretty much it, Souvalis. The current version of POPE is very offense-centric - offloads have more weighting. As mentioned elsewhere on the thread, I'm refining. Watch this space.
souvalis
Roar Rookie
Seriously wonder how Juniors’ POPES exceed Payne Haas’, AMD? Stats table says Payne flogs him everywhere except offloads.
Forty Twenty
Roar Rookie
Latrells crazy antics could mean some of his teammates finish their careers without a premiership ring, it was the key moment of 2021 in the NRL I suspect.
Redcap
Roar Guru
Hi no one, That's really good feedback - thank you. My original copy included a bit about how POPE compares to WAR. I tried to cut-down on words. POPE is not a zero-sum measure - it's cumulative, but can be used as a comparative measure within categories. I am familiar with how WAR works, but an actual replacement level player (as opposed to the replacement-level model) has value, positive or, more likely, negative. I prefer to compare elite players to a contemporary, rather than an abstraction. As mentioned in the piece, I'm not trying to emulate ELO or other advanced metrics. I'm a math idiot doing the best he can.
Redcap
Roar Guru
Hey Monorchid, I do come from Welsh stock. My mother's from Caerphilly. The questions you ask are the big questions of our age. Most of the big organisations we interact with (government and private sector) see us as the sum of our clicks and likes. In a world where so many interactions happen online, rather than through a physical exchange, that's understandable. We are reduced in this world, but analysing sport is fun. Let's not conflate things. By the way, Payne Haas was worth 225 POPEs in 2021. Xavier Coates 322 (POPE is offence-centric). The finals are a way off for the Broncs.