This weekend, Brendon Shields from Rugbycology introduced Roar readers to some of the metrics he uses and applied them to the upcoming Test series.
Brendon wrote: “I hereby invite you to engage and challenge me on aspects you deem interesting!”
My article started as a comment but got bigger. So in the spirit of robust discussion, read on at your peril.
Rugby fans are indeed about to witness an exciting winter tour when the Irish take on New Zealand and the Wallabies host England.
In what is a very interesting article about data analysis of the Test teams participating in the upcoming rugby internationals, Brendon cited a number of statistics that appear to have been gathered from the most recent Rugby Championship (2021) and also the most recent Six Nations (2022).
Without discussing the various definitions and terms used, a few observations might be made about the figures presented and the conclusions and connections drawn.
“During the 2021 Rugby Championship, the Wallabies launched on average 13.3 times from this platform, while the All Blacks launched 12 times. In comparison, during the 2022 Six Nations, Ireland launched 15.6 times and England 14.7 times from kick-returns.”
I would question the validity and value of any inferences made from these numbers.
Can events from different teams at different tournaments against different opposition be meaningfully compared?
And if so, can an average difference of 3.6 kicks be considered (or actually be statistically) significant based on samples size of five and six games respectively?
In such a small sample, a myriad of variables will affect both observations and outcomes.
For example, home versus away games, weather conditions and wind directions (before and during matches), ground conditions, team rankings in the competition at the time of playing, team selections, player availability, injuries before and during the game, officials, referee style, referee bias, the elapsed time of each observation within the match (early, middle, late), current score at the time of the observation, and yellow and red cards during the match.


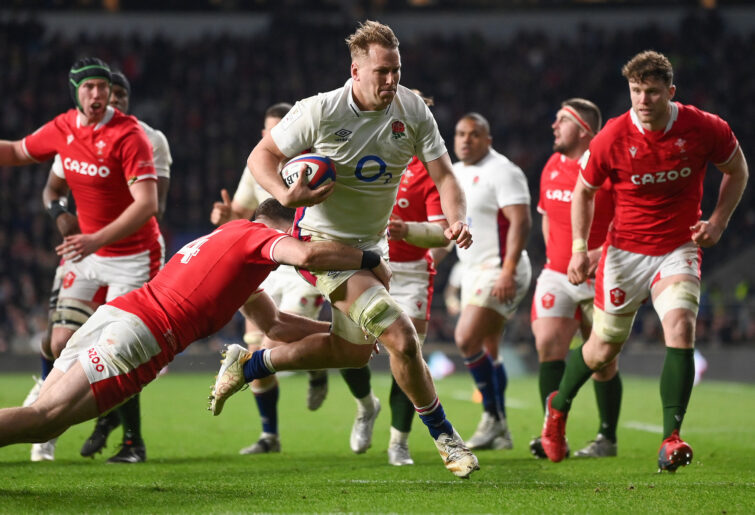
(Photo by Will Russell/Getty Images)
Based on these numbers, Brendon states, “Firstly, it can suggest that teams see Ireland’s kick return as a weakness”.
Ireland played Wales (currently ranked nine), France (two), Italy (14), England (five) and Scotland (seven) – the average opposition ranking was 7.4.
Ireland, now the fourth ranked team in the world, were playing teams whose average ranking was poorer than theirs.
I could also suggest that Ireland’s opposition would (on average) be less likely to have possession, field position, and/or attacking potency – all potentially leading to more kicks.
Brendon continued: “it can suggest that teams see Ireland’s kick return as a weakness, while fearing the All Blacks.”
The All Blacks played Australia (six), Argentina (eight), and the Springboks (one) – their average opposition ranking was five.
The All Blacks are now ranked three (but then were ranked one or two). They were also playing teams whose current average ranking was poorer – but whose average overall ranking was better than that of the Irish opposition.
I could argue that on average the All Blacks would likely also – but to a lesser degree – have more possession, territory, and scoreboard dominance – and that their higher ranked opposition might also have less cause than Ireland’s to kick away possession.
Similarly, Australia (six) played NZ (three), Argentina (eight), Springboks (one) – for an average opposition ranking of four.
Their task could be seen as harder than England (five) who played Scotland (seven), Italy (14), Wales (nine), Ireland (four) and France (two) for an average opposition rating of 7.2.
(Photo by Mike Hewitt/Getty Images)
Throughout the article, Brendon makes statements such as: “Ireland has a 35.5% chance of scoring points when they enter their opponents’ 22 (in the 2022 Six Nations)”.
If the numbers being used are based only on the five games played in the Six Nations, they refer only to events occurring against the opposition in that tournament.
Brendon goes on to say: “in contrast, New Zealand converts only 21.4% of their 7.6 attack starts in that zone (in the 2021 Rugby Championship). England converts at 22.4% of their 7.83 starts to points, while the Wallabies convert 34.8% of their seven opportunities.”
Interesting observations yes, but the basis for valid comparisons?
When you look at the numbers quoted, Ireland scored 2.84 times per game in the Six Nations from inside the opposition 22. Australia scored 2.44 times, England scored 1.75 times and NZ scored 1.63 times.
Based on their relative opponent strength as outlined above, you might argue that Australia would probably come out on top for scoring from inside the 22 against their opposition.
Similar metrics for scoring from other sections of the field might yield different results for each team. Different results would be expected in the World Cup, for example, as pool games would include significantly weaker opposition.
Teams eliminated earlier might have better metrics than teams eliminated later in the tournament as opposition strengths increase. The possibilities and permutations are endless.
“Data analysis in rugby union is really interesting to a point. But with more and more coaches now trusting the science to help them design game strategies we need to be cautious about how we interpret the data.”
I agree.
To paraphrase Kevin Bacon’s character in the famous movie A Few Good Men – whose title incidentally was clearly referring to the Canterbury Crusaders’ dynasty – “these are the facts – and they are undisputed”.
Australia have won 331 of 654 Test matches (50.61%) played.
Australia have won eight (40%) and drawn three (15%) of their last 20 Tests with losses to NZ, France, Wales, England and Scotland.
Australia have played England 52 times for 25 wins (48%) and a draw. In Australia, the Wallabies have won 14 out of 20 Tests (70%).
England have won 422 of 757 international matches (55.75%) played.
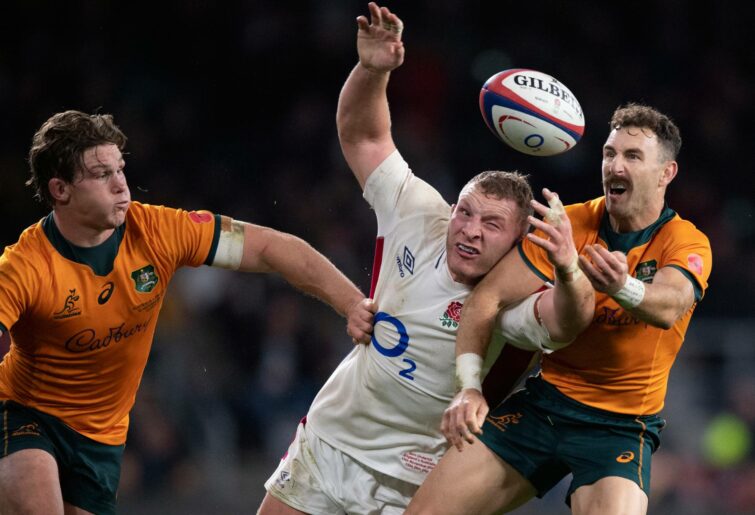
(Photo by Visionhaus/Getty Images)
England have won 13 (65%) of their last 20 matches with losses to Scotland, Wales, Ireland, France and the Barbarians.
England have played Australia 52 times for 26 wins (50%) and a draw. In Australia, England have won six out of 20 (30%) Tests.
Based on these facts and my own internal bias, I am picking a 2-1 series win to the Wallabies.
NZ have won 472 of 612 Test matches (77.12%) and lost at home just 39 (6.37%) times.
New Zealand have won 15 (75%) of their last 20 Tests with losses to Argentina, Australia, South Africa, France and Ireland.
NZ have played Ireland 33 times for 29 wins (87.88%) and a draw. At home against Ireland, they are winning at 100%, having never lost.
Ireland have won 336 of 727 international matches (46.22%).
Ireland have won 13 (65%) of their last 20 Tests with losses to France, Wales, England, New Zealand.
Ireland have played NZ 33 times for three wins (9.09%). All wins came in the last five games (60%). Ireland have played the All Blacks in NZ 12 times with no wins (0%).
Based on these facts and because I’m a Kiwi by birth, I am picking a 3-0 series win to the All Blacks.
I look forward to the fireworks… and also to learning more about the game they play in heaven, but not as well as they play it in Canterbury.
P.S. I am not a data analyst or founder of anything of substance. I possess a database that measures and analyses the game of rugby, called my memory, and that is heavily biased as it is based almost entirely on my own perceptions. Draw conclusions at your own risk. My references are Google and Wikipedia, two highly scientifically robust sources.
Decoy
Roar Rookie
Good summary Harry. Some fields of study (e.g. physics, chemistry, neuroscience) are defined by the scientific method, while others (e.g. psychology, rugby) largely lack the conceptual sophistication and technology to meaningfully apply the scientific method to control for confounding variables. Rugby journalism now aspires to the status science, but in the split second when Even Etsebeth or Sam Cane makes a bone-crushing, face-melting tackle, they do not have calculators or spreadsheets in their pockets.
moaman
Roar Guru
The original title of the article was “Lies, damn lies, and statistics.” I think the original quote was "...lies, damned lies and statistics". :happy:
Harry Jones
Expert
Yes, it seemed like he is working his way into the game, and since I like this sort of chat, I am giving him time to develop his point. Your riposte is equally as valuable, and I enjoyed it. Let it all rip: the Roar is home to Australia's biggest sporting debate. Thanks for your reasoned reply.
Bobbles
Guest
South Africa haven't been to Scotland to play two tests, so no. They have beaten the Wallabies 4 times though, a team who have struggled to beat anyone of note over the last 6 years.
JohnnyOnTheSpot
Roar Rookie
Cheers Busted, You have a solid hypothesis there mate! Simple and statistically robust. Very easy to follow. Happy Days!
JohnnyOnTheSpot
Roar Rookie
Thanks Harry! – always good to have the calm voice of reason on board. As is often the case, you make valid and measured points. The area of analysing rugby for trends, patterns, planning is as intriguing as it is complex. A few observations: I feel the article seemed a wee bit confused at times – maybe because Brendon was trying to simplify his analysis for the non data-analyst readership. It moved quickly into “metrics”, “data” and “analytics” then “launch platforms” and “triads” and then presented numbers and percentages to one and two decimal points. All very data analyst and scientific. Quite exciting really. Then we had the descriptions, explanations and inferences using less precise terms – “a bit more”, “a bit less”, “roughly”, “rather good”, “chuck a different ‘outcome’ into the formula”) and the occasional sweeping generalisation – “most people assume…”, “in Australia for example kicking is often perceived as a negative…”. “Rugby has tiny sampling!” – agreed. So maybe don’t present statistical comparisons that are unlikely to be valid. Comparing what one team (with different match day line-ups) did on average against a few other teams with what another team (with different match-day line-ups) did on average against fewer different teams is OK – but making any sort of valid inferences about what they will or should then do against each other at a later date with different match day line-ups again is IMO drawing a long bow. Basing your inferences on statistics from games and/or series means the sample size will indeed be small. Basing your inferences on statistics from, for example, an individual player over a season(s)/career might offer much greater sample size and potentially more robust insights? – maybe/maybe not. "It’s all estimates + bets." Agreed. But it is presented in a context of statistics and data analysis using numbers and percentages up to 2 decimal places at times. "It wouldn’t pass double blind peer review pharma tests" – and may not be meant to - so maybe don’t present it like it should. "Jake White had just such a set of numbers and guesses."- and so presumably did the opposition coach. How well did that work out? Even a broken clock is right twice a day. Brendon stated at one point, “Thus if we were to understand why teams are more likely to kick against Ireland, the above statistics provide good insight. But that’s not the entire story.” And that’s OK. But if we have to start “pretending” to understand an article, maybe its presentation needs to be reworked. Cheers.
JohnnyOnTheSpot
Roar Rookie
Can't disagree with you on that one... and neither would most of the Australians on this forum!
Double Agent
Guest
But when did Scotland do it?
JohnnyOnTheSpot
Roar Rookie
I don't think that referees are cheats either. Glad we cleared that up. Cheers.
Tooly
Roar Rookie
I don’t think that referees are cheats . I think that it’s a matter of interpretation. For instance I think that Nick Berry and Damon Murphy are familiar with the Reds game , structure and past . The Reds front row perform far better with them. Easily fixed . Don’t have have home town referees at any level .
Shano
Guest
The Wallabies are ranked 6th which is a fair reflection of their very poor last 6 years. Beating SA on home soil (both tests) is not something they should hang there hat on when losing to everyone else.
Double Agent
Guest
I wish you were my teacher. I found that when I went to school my teachers were unreasonably inflexible when it came to correct answers! :shocked: :shocked:
Cassandra
Roar Rookie
Thanks Johnny. I'll sidestep the whole Richie debate as I'm self aware enough to know that I come from a position of extreme bias on the topic. What I did think was a classic example of this unconscious bias towards the higher ranked team was O'Keefe's refusal to give the Brumbies that penalty in the semi against the Blues. I think, had the positions been reversed, he would have awarded the penalty to the Blues.
Harry Jones
Expert
It's a bit like when we ask a jury to evaluate what HR did in a situation. Both the jury and HR would love to have had more information (complete, fair, trustworthy, proved) but both will end up deciding if the guy did or did not harass his subordinate based on deductive inference. If you require absolute surety, the harasser will always survive! Haha!
AndyS
Guest
It was a comment replying to Highlander, noting that the question might be what and whose set of metrics got used. The metrics can be good or bad, but that was the principle of the original moneyball; that some of the standard measures (and particularly those associated with things that 'everyone knows') actually aren't that useful and miss things that can be more important. Similarly, I don't know by what metrics my acquaintance in Japan was making his assessment, but whatever they were clearly looked past the details of the pool results and were able to correctly assess the final outcome. Don't know whether they incorporated data prior to the tournament, I didn't think to ask, but it was a ballsy call seeing as the bloke in question had a strong alignment to one of the other teams in the running and wouldn't have been allowed to forget it in a hurry.
Carlos the Argie
Roar Guru
You make an interesting comment! People look for validating and predictive statistics and given the type of sport, it is very difficult. As I said above, baseball is a terrible example. You can look at tendencies but also remember that the smartest team can and does change the way they play DURING the game and affect tendencies. Rugby is funny. Everyone is looking for the main findings statistically without understanding that sampling variation will always work against you. The opposite happens in the “audiophile” world, where statistics and measurements are extremely robust and reproducible (pun intended) and those that call themselves “audiophiles” reject measurements and statistics for mythical arguments without any substantiation. You can have the same person “data oriented” when looking at a rugby game and a complete mystic when listening to his stereo. Humans. Why can’t we be a little bit more rational?
Harry Jones
Expert
The new Roar boffin getting a baptism of fire! Well, pretend the word isn’t stats. Rather, pretend B has gathered a set of numbers which arrange into noticeable trends or traits from which he wants to draw a few reasonable inferences upon which he will construct doctrines after a few hypotheses have been postulated. Rugby has tiny sampling! It’s not cricket or baseball! We can see in a 6N that Ireland does a thing (build a ruck, pass, run) almost twice as much as England or France, and that this requires a lot of cleaning to operate. So, then we can go to guy like Sam Larner and see who is doing the cleaning for Ire, Fra, Eng. A foe can deduce — approximately, imperfectly — how to tie up those cleaners, or turn carriers into tacklers. It’s all estimates + bets. It wouldn’t pass double blind peer review pharma tests. But it’s a window into how a real coach has to tell a real squad to go to Dublin and beat Leinster. Jake White had just such a set of numbers and guesses.
Busted Fullback
Roar Rookie
Hey JOTS, I once gave the same set of stats to two different sides of an argument in one of my classes. They were both successful and passed their assignment.
Busted Fullback
Roar Rookie
G’day JOTS. For me, stats are history. Every time a game starts, we’re looking into the future, new circumstances, new conditions, new attitudes from the players... NEW. Sit back, enjoy, and hope the outcome goes your way.
Busted Fullback
Roar Rookie
Of course there is jez. Life wouldn’t be worth living otherwise. :silly: :silly: :laughing: