When preparing a statistical preview of a State of Origin match you must consider two factors.
The two sides haven’t played for ten months, and there have been a number of changes to the lineups since then.
To get the best indication of how this Monday night’s match will pan out, I have looked at two things.
1. The full 36 seasons of State of Origin that have gone before, specifically the game one results, and
2. The key statistics of each of the selected players this year for their individual clubs and the possible team picture that presents when they are accumulated.
The History
Overall
Not including the exhibition match in Los Angeles in 1987, there have been 104 State of Origin games played:
Queensland: 58
NSW: 46
These matches have been played in either Brisbane, Sydney or Melbourne:
Brisbane: 53
Sydney: 44
Melbourne: 7
The results in each city are as follows:
Brisbane: Queensland 35, NSW 17, Draw 1
Sydney: Queensland 18, NSW 25, Draw 1
Melbourne: Queensland 4, NSW 2, Draw 1
State of Origin Game 1 coverage
» Where Game 1 will be won and lost
» Prichard: The Blues know they can win. It’s up to them to actually do it
» Origin expert tips and predictions
» Origin 1 margin, man of the match and first try scorer predictions
Game 1 records
Since 1982 when the three-game series format began there have been 34 series and the according amount of ‘Game 1s’. The record stands thusly:
Queensland: 18
NSW: 16
Of those 34 games 17 have been held in Brisbane:
Queensland: 9
NSW: 8
So what does this all tell us?
1. Queensland have won 60.32 per cent of all Origin games,
2. NSW have won 39.68 per cent of all Origin games,
3. Queensland have won 66 per cent of the games held in Brisbane but,
4. It is almost 50/50 between the two sides when it comes to winning Game 1 when it is held in Brisbane. Remember that the last time that NSW won the series they won Game 1 in Brisbane.

(AAP Image/Dan Peled)
So what sort of match can we expect?
Average scores
Over the entirety of State of Origin this is the average score:
Queensland: 16.9 NSW: 15.3
This is the average score for games in Brisbane:
Queensland: 20.2, NSW: 14.5
This is the average score for Game 1s in Brisbane:
Queensland: 17.4, NSW: 14.6
This is the average score of Queensland victories in Game 1s in Brisbane:
Queensland: 22.3, NSW: 12.1
This is the average score of NSW victories in Game 1s in Brisbane:
Queensland: 10.75, NSW: 18.1
So what does this tell us?
1. Queensland score a fair bit more points when they are at home
2. NSW only score slightly fewer points away from home
3. Game Ones are on average tight affairs
We can expect a fairly grinding game which is highly unlikely to be won by a margin of 13+ by either side.
While Game 1 is the second highest scoring game in the series on average – Game 3 being easily the most free-scoring (probably due to dead rubber games) – over the last five seasons the average score of Game 1s has been 10-10.
Further, there have been only six games that have had a combined score of ten points or less over the history of State of Origin. Four of them have been in Game 1 – the most recent being Game 1, 2016.
So we can expect another dour, defensive battle on Wednesday night.
[latest_videos_strip category=”rugby-league” name=”League”]
And there is a very good reason for it being so hard fought: 76.5 per cent of the time the side that wins this game will win the series. 26 times over the 34 series the team that drew first blood went on to lift the shield (includes drawn series when the shield was retained). However, of the eight times that a side has come back from one nil down to clinch the series, three of them were in the Maroons run of eight straight series victories.
As Queenslanders are very quick to remind New South Welshmen, the Sky Blues have only won one series out of the last eleven. The one series the Blues did win, they won Game 1 away in Brisbane.
While I am a Cro-Magnon who still misses and laments the passing of the biff, it is clear that Game 1 is on like Donkey Kong this Wednesday.
So how do the sides match up?
Age and experience = NSW/Queensland
| NSW | Origin games | Age | Queensland | Origin games | Age |
| James Tedesco | 1 | 24 | Darius Boyd | 26 | 29 |
| Blake Ferguson | 4 | 27 | Corey Oates | 3 | 22 |
| Josh Dugan | 9 | 27 | Will Chambers | 4 | 28 |
| Jarryd Hayne | 20 | 29 | Justin O’Neill | 3 | 26 |
| Brett Morris | 11 | 30 | Dane Gagai | 4 | 26 |
| James Maloney | 7 | 30 | Anthony Milford | 0 | 22 |
| Mitchell Pearce | 15 | 28 | Cooper Cronk | 19 | 33 |
| Aaron Woods | 11 | 26 | Dylan Napa | 0 | 24 |
| Nathan Peats | 0 | 26 | Cameron Smith | 39 | 33 |
| Andrew Fifita | 7 | 27 | Nate Myles | 31 | 31 |
| Josh Jackson | 5 | 26 | Josh Papalii | 6 | 25 |
| Boyd Cordner | 6 | 24 | Matt Gillett | 15 | 28 |
| Tyson Frizell | 2 | 25 | Josh McGuire | 5 | 27 |
| David Klemmer | 6 | 23 | Michael Morgan | 5 | 25 |
| Wade Graham | 2 | 26 | Sam Thaiday | 28 | 31 |
| Jake Trbojevic | 0 | 23 | Aidan Guerra | 9 | 29 |
| Jack Bird | 2 | 22 | Jacob Lillyman | 14 | 33 |
| Total | 108 | 26 | Total | 211 | 27.8 |
New South Wales do not have a single player over the age of 30. The Maroons have five: Cam Smith, Cooper Cronk, Sam Thaiday, Nate Myles and Jacob Lillyman. Again, while Smith and Cronk are still at the top of their game, are Myles, Thaiday and Lillyman? Are they going to reprise their own version of the great Petero Civoneceva’s disappointing last series?

(AAP Image/Dan Himbrechts)
Experience is a bit lopsided. Queensland have 211 games of experience up against NSW’s 108. However, 143 of those games (68 per cent) rest with just five players: Cam Smith, Nate Myles, Sam Thaiday, Darius Boyd and Cooper Cronk.
They have eight players in their team who have played five games or less, including two debutants. They are missing Jonathan Thurston, Greg Inglis and Matt Scott, all of whom have been fixtures during the Queensland era of dominance.
The Blues only have one player boasting 20 caps – and that is the returning Jarryd Hayne. The next best after that is the oft-maligned Mitchell Pearce with 15, then Brett Morris and Aaron Woods on 11 apiece. Then there are six players who ‘boast’ two games or less, including debutants Nathan Peats and Jake Trbojevic. How is that going to go in the Suncorp cauldron? Especially when their combined losing margin in the Blues’ last three visits there is 81 points.
Minutes in the legs = NSW
The end of Petero Civoneceva in the Origin arena was a whimper rather than a bang. Almost universally respected as a superb bloke and sensational player, his body just wasn’t quite up to it in his final series and he was exposed. The same could happen here for Nate Myles and Jacob Lillyman – and maybe even Sam Thaiday.
All the NSW players average playing minutes in 2017 total 58.2 minutes more than their Queensland opponents. That means on average that each player is 3.4 minutes more match conditioned a game.
However, when you look at the forwards the difference in the two sides averages blows out. Just look at this:
| NSW Pack | Average minutes 2017 | Queensland pack | Average minutes 2017 |
| Josh Jackson | 78.7 | Josh Papalii | 80.2 |
| Nathan Peats | 77.4 | Cameron Smith | 80 |
| Boyd Cordner | 78.6 | Matt Gillett | 75.4 |
| Tyson Frizell | 66 | Josh McGuire | 63.5 |
| David Klemmer | 58.2 | Sam Thaiday | 61.7 |
| Wade Graham | 76.3 | Aidan Guerra | 52.5 |
| Jake Trbojevic | 75.9 | Jacob Lillyman | 48.7 |
| Aaron Woods | 54.4 | Dylan Napa | 47.4 |
| Andrew Fifita | 54.3 | Nate Myles | 34.9 |
| Combined Total | 619.8 | Combined Total | 544.3 |
| Average per player | 68.86 | Average per player | 60.5 |
The NSW forwards have an average of 8.36 more minutes in their legs than their Queensland opponents.
NSW have no forwards who average less than 54 minutes match time. Queensland have three that average less than 50. Nate Myles doesn’t even play half a game on average. This could be telling.
Runs and metres = NSW
This will be vital to who wins and on paper NSW has the edge.
| NSW | Average runs | Average metres | Queensland | Average runs | Average metres |
| James Tedesco | 17.1 | 177.6 | Darius Boyd | 13 | 111.6 |
| Blake Ferguson | 14.2 | 134.7 | Corey Oates | 15.8 | 173.9 |
| Josh Dugan | 16.6 | 153.7 | Will Chambers | 13.8 | 123.5 |
| Jarryd Hayne | 11.3 | 89.3 | Justin O’Neill | 8 | 72.8 |
| Brett Morris | 12 | 106.5 | Dane Gagai | 12.6 | 115.5 |
| James Maloney | 9.6 | 70.5 | Anthony Milford | 12.7 | 99.8 |
| Mitchell Pearce | 10.7 | 66.4 | Cooper Cronk | 8.6 | 62.5 |
| Aaron Woods | 16.4 | 154.7 | Dylan Napa | 13 | 109.6 |
| Nathan Peats | 4 | 30.6 | Cameron Smith | 8.6 | 55 |
| Andrew Fifita | 16.7 | 157 | Nate Myles | 7.9 | 83.2 |
| Josh Jackson | 13 | 111 | Josh Papalii | 14.9 | 152.8 |
| Boyd Cordner | 15.8 | 154 | Matt Gillett | 10.7 | 87.5 |
| Tyson Frizell | 10.6 | 100.2 | Josh McGuire | 16.6 | 153.9 |
| David Klemmer | 16.3 | 160.3 | Michael Morgan | 9.4 | 71.2 |
| Wade Graham | 12.2 | 112.5 | Sam Thaiday | 10.8 | 100.3 |
| Jake Trbojevic | 14 | 132.4 | Aidan Guerra | 10.1 | 92.5 |
| Jack Bird | 14 | 123.1 | Jacob Lillyman | 14.6 | 137.4 |
| Total | 224.5 | 2034.5 | Total | 201.1 | 1803 |
| Average per player | 13.2 | 119.7 | Average per player | 11.8 | 106 |
It is clear that not only are there more minutes in the NSW legs, there are more hit-ups and more metres as well.
Again, in the forwards this difference becomes even more pronounced. The NSW pack average 123 metres a man against Queensland’s 108. That equates to 140 metres for a game.
NSW have three players who average less than 100 metres a game: James Maloney, Mitchell Pearce and Nathan Peats. Queensland has eight.
Tackles and Missed Tackles = equal
Defence in State of Origin is huge. The statistics show the two sides to be almost identical where tackling is concerned.
| NSW | Tackles | Missed Tackles | % missed tackles to tackles made | Queensland | Tackles | Missed Tackles | % missed tackles to tackles made |
| James Tedesco | 3 | 1.4 | 31.80% | Darius Boyd | 7.6 | 0.7 | 8.40% |
| Blake Ferguson | 5.2 | 1.7 | 24.60% | Corey Oates | 2.9 | 0.9 | 23.70% |
| Josh Dugan | 3.9 | 1.1 | 22% | Will Chambers | 18.2 | 2.6 | 12.50% |
| Jarryd Hayne | 7.3 | 1.3 | 15% | Justin O’Neill | 10.4 | 1.3 | 11.10% |
| Brett Morris | 6.2 | 0.8 | 11.40% | Dane Gagai | 14.4 | 3.2 | 18.20% |
| James Maloney | 13.7 | 6.2 | 31.10% | Anthony Milford | 11 | 3.5 | 24.10% |
| Mitchell Pearce | 21.4 | 2.4 | 10% | Cooper Cronk | 14.9 | 1.1 | 6.90% |
| Aaron Woods | 24 | 1.3 | 5.10% | Dylan Napa | 21.3 | 3.4 | 13.75% |
| Nathan Peats | 38.8 | 2.2 | 5.36% | Cameron Smith | 41.4 | 1.7 | 4% |
| Andrew Fifita | 28.6 | 1 | 3.40% | Nate Myles | 18.2 | 1.9 | 9.45% |
| Josh Jackson | 33.6 | 1.8 | 5% | Josh Papalii | 26.1 | 1.1 | 4% |
| Boyd Cordner | 31.3 | 2.1 | 6.30% | Matt Gillett | 37.1 | 4 | 9.70% |
| Tyson Frizell | 29 | 1.6 | 5.20% | Josh McGuire | 37.2 | 2.4 | 6.10% |
| David Klemmer | 22.3 | 1.9 | 7.85% | Michael Morgan | 13.6 | 2.7 | 16.50% |
| Wade Graham | 28.3 | 2.9 | 9.30% | Sam Thaiday | 22.1 | 1.8 | 4.20% |
| Jake Trbojevic | 37 | 1.2 | 3% | Aidan Guerra | 30.4 | 1.9 | 5.90% |
| Jack Bird | 11.6 | 3.5 | 23.20% | Jacob Lillyman | 24.6 | 2.3 | 8.50% |
| Total | 345.2 | 34.4 | Total | 351.4 | 36.5 |
Obviously the fewer tackles you make the worse a miss looks in the ratio. So James Tedesco, Blake Ferguson and Josh Dugan’s poor ratios can be ignored.
Talking to Billy Moore last week he raised the point that he cannot think of any player in the history of Origin who has been a first choice five-eighth for their state who was simultaneously the leagues worst tackler and biggest conceder of penalties.

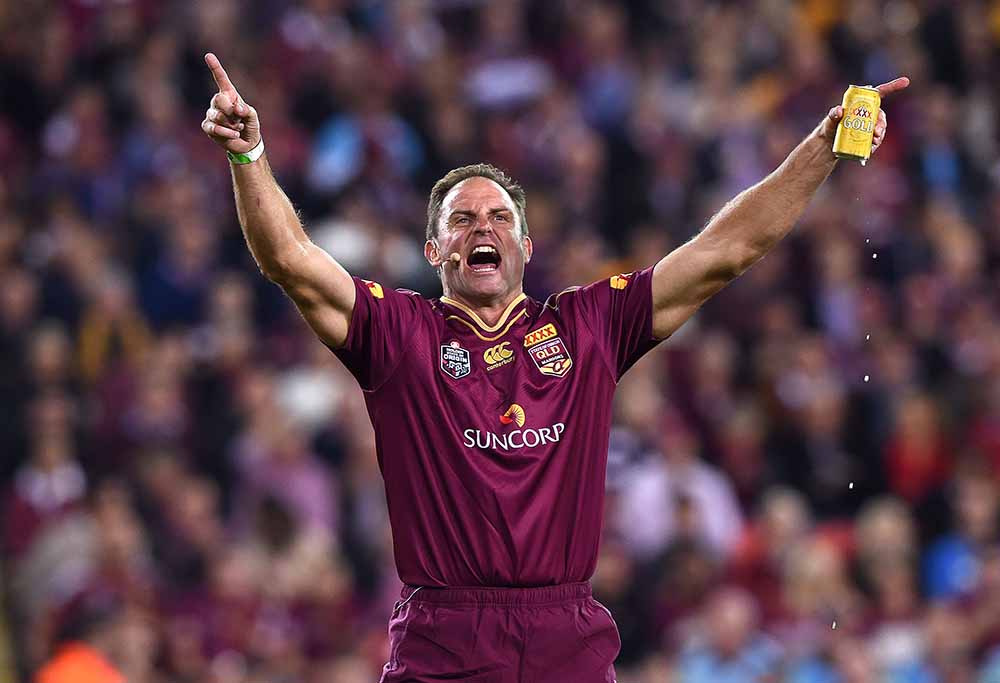
(AAP Image/Dave Hunt)
Ladies and gentlemen, I give you James Maloney. Traffic will be coming his way. Other players who will possibly be targeted by Queensland are David Klemmer and Wade Graham and Jack Bird.
For Queensland, Will Chambers’ defence is a bit suss but the real risk comes with their new starting front rower, Dylan Napa. 13.75% is a high ratio of missed tackles for the Origin arena up front. You can bet that Laurie Daley is aware of this shortcoming too.
Attacking and scoring = NSW
| NSW | Tackle breaks | Line break assists | Line breaks | Try Assists | Tries | Queensland | Tackle breaks | Line break assists | Line breaks | Try Assists | Tries |
| James Tedesco | 7.7 | 0.6 | 0.6 | 0.4 | 0.1 | Darius Boyd | 3.3 | 0.7 | 0.2 | 0.5 | 0.2 |
| Blake Ferguson | 3.1 | 0.1 | 1 | 0.1 | 0.7 | Corey Oates | 3.1 | 0 | 0.6 | 0.1 | 0.5 |
| Josh Dugan | 6.1 | 0.3 | 0.4 | 0 | 0.3 | Will Chambers | 1.4 | 0.7 | 0.4 | 0.4 | 0.3 |
| Jarryd Hayne | 1.3 | 0.3 | 0.5 | 0.3 | 0.5 | Justin O’Neill | 1.5 | 0 | 0.1 | 0 | 0 |
| Brett Morris | 3.5 | 0.1 | 0.5 | 0.1 | 0.3 | Dane Gagai | 5.2 | 0.1 | 0.3 | 0.1 | 0.1 |
| James Maloney | 1.3 | 0.3 | 0.4 | 0.2 | 0.4 | Anthony Milford | 4.2 | 0.6 | 0.4 | 0.6 | 0.4 |
| Mitchell Pearce | 2.2 | 0.6 | 0.6 | 0.6 | 0.4 | Cooper Cronk | 1.2 | 0.5 | 0.2 | 0.5 | 0.5 |
| Aaron Woods | 0.8 | 0 | 0 | 0 | 0 | Dylan Napa | 1.1 | 0 | 0 | 0 | 0 |
| Nathan Peats | 0.6 | 0.6 | 0 | 0.8 | 0 | Cameron Smith | 0.8 | 0.6 | 0 | 0.4 | 0 |
| Andrew Fifita | 4.2 | 0.1 | 0.2 | 0.1 | 0.1 | Nate Myles | 0.1 | 0 | 0 | 0 | 0 |
| Josh Jackson | 1.2 | 0.1 | 0.3 | 0.1 | 0.1 | Josh Papalii | 3.4 | 0.4 | 0.5 | 0.3 | 0.3 |
| Boyd Cordner | 1.6 | 0 | 0.3 | 0 | 0.1 | Matt Gillett | 2.3 | 0.1 | 0.2 | 0.2 | 0.1 |
| Tyson Frizell | 2.1 | 0.1 | 0.1 | 0 | 0 | Josh McGuire | 1.3 | 0 | 0 | 0 | 0 |
| David Klemmer | 1.8 | 0 | 0 | 0 | 0 | Michael Morgan | 2.6 | 0.2 | 0.5 | 0.6 | 0.4 |
| Wade Graham | 2.1 | 0.4 | 0.6 | 0.4 | 0.3 | Sam Thaiday | 1.2 | 0.1 | 0.1 | 0 | 0.2 |
| Jake Trbojevic | 1.2 | 0.3 | 0.4 | 0 | 0.4 | Aidan Guerra | 2.8 | 0 | 0 | 0 | 0 |
| Jack Bird | 3.6 | 0.4 | 0.2 | 0.4 | 0.1 | Jacob Lillyman | 0.5 | 0 | 0 | 0 | 0 |
| Total | 44.4 | 4.3 | 6.1 | 3.5 | 3.8 | Total | 36 | 4 | 3.5 | 3.7 | 3 |
The big difference here is just how many more line breaks the NSW side potentially has in them. These stats see them breaking the line nearly twice as much as Queensland and scoring an extra try. As you’d expect, Mitchell Pearce is NSW main hope of getting players through the line. However, he’s not.
It’s actually Nathan Peats. Who knew? Of course Wade Graham and Jack Bird also pose danger. And these stats say that Blake Ferguson is the person most likely to score a try.
For Queensland there is well-known danger all across the field. Darius Boyd, Michael Morgan, Cooper Cronk, Anthony Milford and Cam Smith are all proven ball players. Cronk and Corey Oates the men most likely to score a try.
And have a look at James Tedesco’s tackle breaks. That’s impressive stuff. He poses incredible danger.
Miscreants and fumblers = Queensland
If there is a more vital statistic in rugby league games than possession I don’t know what it is… Who controls the ball and has more sets is 75 per cent of the way to winning. So which side is more likely?
| NSW | Errors | Penalties conceded | Queensland | Errors | Penalties conceded |
| James Tedesco | 1.4 | 0.6 | Darius Boyd | 0.3 | 0.1 |
| Blake Ferguson | 1 | 0.3 | Corey Oates | 1.2 | 0 |
| Josh Dugan | 0.9 | 0.4 | Will Chambers | 1.1 | 1 |
| Jarryd Hayne | 0.7 | 0.3 | Justin O’Neill | 0.3 | 0 |
| Brett Morris | 0.9 | 0.3 | Dane Gagai | 0.8 | 0.4 |
| James Maloney | 1.3 | 2 | Anthony Milford | 1.6 | 0.4 |
| Mitchell Pearce | 0.9 | 0.7 | Cooper Cronk | 0.6 | 0.6 |
| Aaron Woods | 0.4 | 0.3 | Dylan Napa | 0.1 | 0.1 |
| Nathan Peats | 0.6 | 0.8 | Cameron Smith | 0.5 | 0.6 |
| Andrew Fifita | 1 | 0.8 | Nate Myles | 0.1 | 0.5 |
| Josh Jackson | 0.7 | 1 | Josh Papalii | 0.3 | 0.1 |
| Boyd Cordner | 0.7 | 0.1 | Matt Gillett | 0.9 | 0.3 |
| Tyson Frizell | 0.3 | 0.5 | Josh McGuire | 0.4 | 0.5 |
| David Klemmer | 0.6 | 0.8 | Michael Morgan | 1.4 | 0.6 |
| Wade Graham | 0.9 | 0.8 | Sam Thaiday | 0.5 | 0.5 |
| Jake Trbojevic | 0.3 | 0.9 | Aidan Guerra | 0.5 | 0.4 |
| Jack Bird | 1.6 | 0.6 | Jacob Lillyman | 0 | 0.6 |
| Total | 14.2 | 11.2 | Total | 10.6 | 6.7 |
Queensland clearly has better discipline and ball control. NSW give away 4.5 more penalties a game and make three and a half more errors. You can bet your backside that in the cauldron of Suncorp Stadium those stats could well come true. If they do it’s hard to see Queensland losing.
Leadership = Queensland
I am a Boyd Cordner fan. He is a quality player and will be a great leader one day but he has been served a shit sandwich here. But who else is there? Aaron Woods? Jarryd Hayne?
For someone who was such a superb NSW captain himself, Laurie Daley has selected a side with no proven leaders. While I’m sure he will be a good captain one day, it’s a bit harsh to throw Jake Trbojevic into the captaincy in his first game, although I’ll be stunned if he isn’t in Sky Blue for a very long time.
So Cordner really is the best option. However, mountains of pressure will be brought to bear on him. He’s 24 years old and he’s not yet captained half a season. Now he’s up against the most successful and experienced representative captain in the history of rugby league. How Cordner stands up to it will be a big factor in who wins this game.
(AAP Image/Dean Lewins)
How Cam Smith and his deputies – Cronk, Boyd, Myles, Morgan and Thaiday – use their tried and tested leadership and boatloads of experience that was forged in the heat of the heaviest frays will have a major bearing on this game.
When the chips are down the Maroons will know what to do. I find it hard to believe that NSW will be able to be composed.
The verdict
If NSW are to win it will be on the back of a blitzkrieg in the opening 20 minutes. However, if Queensland are still in the match after that expect them to grind out a win on the back of a parochial home crowd and experience that only comes with having been there and done that.
Queensland by four.
Crusaders.Fan
Guest
I follow rugby more but certainly respect all codes. What struck me about Origin was how many yellow and red cards would have been given for the tackles had it been union. Im all for tough football but in this day it seems League is about 10yrs behind for player welfare. I would go as far as saying there will be legal cases where a player could point to say Union and say the ARL was negligent in not following readily available practice for player welfare. So not trolling as I respect all but seems league is behind the times. And probably there are codes with much better management than union
Alex
Guest
Great article, but in retrospect couldn't have been more inaccurate. I guess stats do lie at times
Peter
Guest
All these hopefuls saying this year (unlike 11 of the last 12) is NSW's because well, statistics... Reminds me of a cartoon from 40 years ago: "Statistics prove that a horse of this size cannot carry this weight this far in this short a time... But if Georgie Moore's up he'll romp it In!" Same same Queensland, really. :-)
Bunney
Roar Rookie
Massive Qld and Petero fan here, but Tim is right. He was lucky to get picked and largely a passenger in his final series
Bunney
Roar Rookie
Metres gained per individual is very flawed all of the time. Broncos vs Tigers a couple of weeks back, 36-0 Broncos. Compare the fullbacks. Tedesco didn't do much, but had 170+ metres, Boyd was great, ran "only" 100m. Tedesco gets tackled with the ball more in attack, and Boyd's defensive positioning is better so he mops up little kicks into the in-goal and squirts 2-3 metres to get back into the field of play while Tedesco would have to rush it dead, or even let in a try. THese factors do not show in a simple metres gained analysis. Metres post contact - that's a stat I like.
Bunney
Roar Rookie
Don't forget the 20min half time breaks.
The Barry
Roar Guru
What?!?! That's truly outrageous.
Magnus M. Østergaard
Roar Guru
NSW sold most of their games interstate for a cash grab. Who has short memories now? Farqueue Wayne Kerr
Farqueue
Guest
I was way out in my penalty count. According to David Middleton, NSW has won the penalty count in QLD 7 times out of 54 games. Surprising they have won that many really.
Farqueue
Guest
Why the hell have QLD played 9 extra games at home. That is not much less than their overall winning tally over NSW. I remember qld supporters complaining that NSW bought an extra game and it was unfair just a few years ago. Short memories.
Farqueue
Guest
I hated last week. Only 4 games...That's crap. If your team is blessed with many origin players. Lucky you. It's the only time of year us supporters of poor scummy teams can beat the top teams. Still the rich powerful clubs complain. Play full rounds every week. Many players on a salary bigger than the prime minister. It may be the most brutal team sport in the world but they are payed exceptionally well.
Farqueue
Guest
I totally agree. Penalty counts are very important. NSW have won the penalty count in qld less than 15 times in 53 starts. Qld obviously very disciplined at home. Sutton and Cechin to be the big talking points after the game. Unfortunately.
Lidcombe Oval
Guest
I Know 9 doesn't want to change the game day for SOO but surely this has to be addressed in the future- mid week is not good for families nor the prices I would suggest - why not Saturday night - have byes that week too for all NRL teams- Only 3 times a year and the TV audience numbers wont change when it is known in advance when these games are played.
Simon
Guest
I was surprised, then I looked at the ticket prices and I'm surprised they sold that many. The NRL really love to screw their fan base for every cent. Should be a cracker though
Graham
Guest
this is a dangerous series for queensland I feel that their enters have less flair and both napa and gillett are capable of letting in soft tries. Also Oates is suspect under the highball QLD have a very low mistake rate so could play possession footy but to do so you need to be able to get a lot of dropouts. Dropouts are a weakness in milfords game (then again smith and cronk are excellent at this) The teams are pretty even for the first time in a while. If QLD play with their famous heart though how the teams look on paper may not matter
V.O.R.
Guest
Ha, ha, yes! Phil Gould has never let Queensland down. You think he would learn. Another key SOO stat is the large number of NSW players that go missing on debut in the maroon cacophony at rugby leagues cauldron. Not talked about much but I think NSW has 4 players that have not played SOO in QLD. Tedesco, Peats, Graham & Jake Trbojevic. Two SOO games at ANZ Stadium between them. They will be playing the fastest game of their lives at the foot of Australia's most hostile sporting crowd. When fatigue sets in with the Maroons camped on the Blues try line the uninitiated will be in Rugby Leagues version of Hell.
Bloody R Bull
Roar Rookie
NSW have to play better then they could ever imagine to win the 1st game in Brisbane, dreams do come true !!! Especially the way the media is bagging QLD, this is what them Maroons feed off, always have !! Only after a NSW win game 1 will it set NSW up for the series win. 2 games in Brisbane, QLD will win 1 of these games, history is on their side. Don't wait till game 3, could be to late. Go The Blues
Eden
Guest
I tend to agree on the minutes and metres and essentially everything else conpared to minutes. Nsw have more minutes in legs but you only get 13x80 minutes to share around. If you had metres per minute against available minutes then you'd have a clearer picture. However definitely better than the old try assist and line break analysis served up by media
Albo
Guest
Tim you have put some work into generating a lot stats. But for me a lot of these are meaningless in predicting a likely result. For me, the result is still determined by dominance in field position. Whilst we try to focus on the packs and trheir running and tackling stats, for me the key indictors become the quality of the kicking games, the quality of the chasing games and the quality of the kick returns from defence. So the key players become Smith & Cronk versus Pearce & Maloney for their kicking game quality, the kick chase of the outside backs from both sides, and the kick returns from the back 5 of each team. My amateur assessment in these three aspects : Kicking consistency goes to Smith & Cronk, but on his night Pearce's longer kicks could be vital. Kick chase should be even if all are on their game. Kick returns I give a slight advantage to NSW's back 5 due to Tedesco's speed of the mark, and Morris's guile bringing the ball back. Overall, if Pearce has his kicking game in order, I would expect NSW to have an advantage in the field position. If not, NSW's back 5 will have busy night bringing the ball off their line.
Griffo 09
Roar Rookie
Hi Tim. Enjoyed the article. Really very thorough and enlightening. A few of points to pull you up on though. By my calculations there have been 35 series to date. There have been 8 games played in Melbourne, with QLD winning 4 and NSW winning 4 (no draws). 18 series openers have been staged in Brisbane of which QLD have won 9 and NSW 9. I didn't check your other stats for overall wins at each venue. The only reason I know these is because I submitted an article myself regarding home ground advantage in state of origin which will hopefully be published today or tomorrow!