Joe Burns’ vast experience of playing on difficult pitches in the Sheffield Shield could help him finally lock down a Test spot this summer.
As an opener based on arguably the most pace-friendly Shield pitch in the country, Burns has had a tough gig. That has probably prevented him from piling up massive runs in the Shield and making himself impossible to ignore, like Victorian Marcus Harris did.
On the flip side, the tricky Gabba pitches have made Burns more battle-hardened for Test cricket than Harris, who has far more favourable home batting conditions.

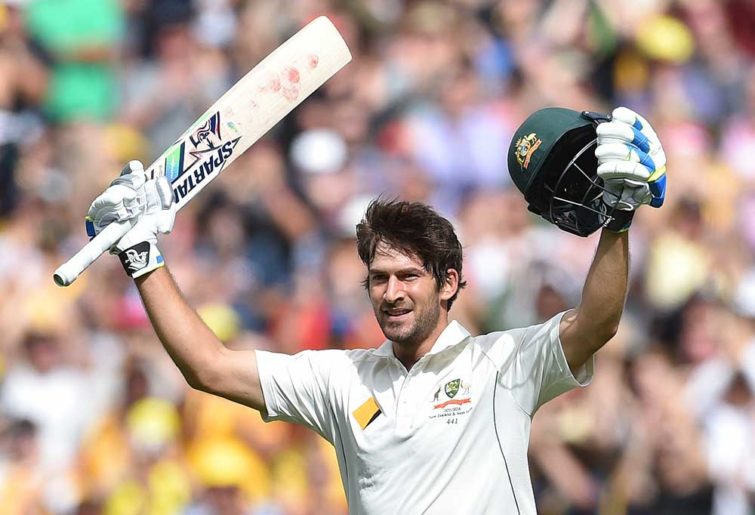
(AAP Image/Tracey Nearmy)
When Shield batting records are discussed, too little attention is paid to the hugely varied conditions across Australia.
Assessments of Test records always take into account, for example, the gulf in difficulty between batting on moister, seaming pitches in England, and on drier, truer surfaces in Australia. That’s why Marnus Labuschagne’s 353 runs at 50 in the last Ashes is universally considered a better performance than Shaun Marsh’s 445 runs at 74 in the previous Ashes in Australia.
Many Test cricketers are taken to task for their poor records away from home. Australian batsmen David Warner and Usman Khawaja are classic examples, regularly criticised for the yawning gap between their home and away Test averages.
Then why don’t we pay more attention to the venues Shield batsmen prosper and falter at? In the past decade, two Shield grounds have been clearly more difficult for batting than any others: Bellerive Oval and the Gabba. Those two grounds have regularly hosted low-scoring Shield matches where quicks have exploited juicy pitches.
By comparison, the MCG, Adelaide Oval, WACA and SCG have been far better for batting overall. For the sake of discussion, let’s separate these two groups of grounds into categories. Two grounds (Gabba and Bellerive) will be labelled tougher, while four grounds (MCG, Adelaide, WACA and SCG) will be called easier.
Now let’s consider the first-class records of some of Australia’s fringe Test batsmen at these grounds.
| Batsman | Tougher | Easier |
|---|---|---|
| Matthew Wade | 2537 runs at 55 | 3053 runs at 37 |
| Joe Burns | 2736 runs at 37 | 2206 runs at 47 |
| Kurtis Patterson | 582 runs at 34 | 1813 runs at 44 |
| Cameron Bancroft | 575 runs at 32 | 2436 runs at 38 |
| Marcus Harris | 729 runs at 29 | 3085 runs at 37 |
| Travis Head | 712 runs at 25 | 3007 runs at 37 |
It should be acknowledged that Wade (Tasmania) and Burns (Queensland) are based on tougher pitches, which has given them more opportunity to adapt to those conditions.
One other important fact not evident in those stats, because they’re limited to Australia’s six main grounds, is that Harris’ first-class record is inflated by his extraordinary record at the country’s flattest pitch – the Junction Oval. At that ground in St Kilda, Harris has churned out 800 runs at 89 from just five matches.
Burns, by comparison, has only been lucky enough to play one first-class match on that batsman’s paradise, making scores of 80 and 60. Bancroft, meanwhile, has never played at the Junction Oval. The deck was so dead during the recent Shield fixture at that ground that the match descended into a farce. Nearly 1300 runs were scored for the loss of just 12 wickets. It was a nonsense. Harris made 116.
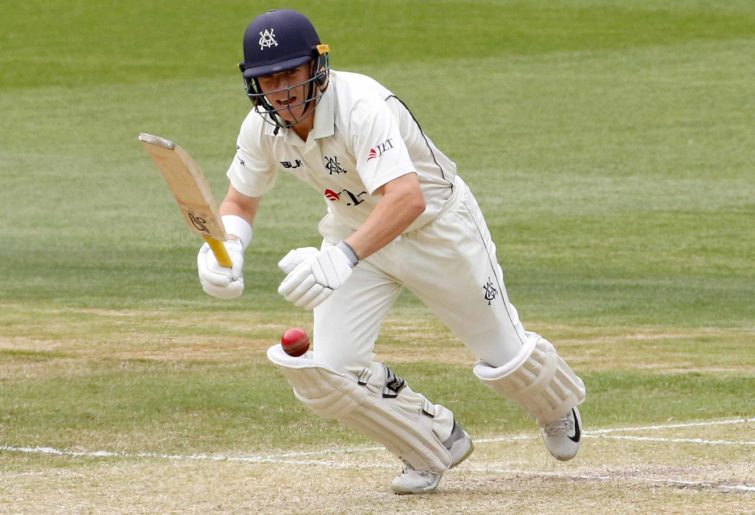
(AAP Image/Hamish Blair)
Without intending to demean the efforts of Harris, it is notable that his rise to prominence coincided with his move to Victoria, where between the MCG and the Junction Oval he gets the best home batting conditions available.
In his 19 matches on those two uber-flat Victorian pitches he has made 1846 runs at 60. Compare that to Harris’ record across his other 71 first-class matches of 4031 runs at 32.
It is arguable, then, that Harris’ fortune in having regular access to the best batting conditions in Australia is a major factor in him getting picked in Tests ahead of Burns over the past year.
In the two Tests where Burns and Harris played together, against Sri Lanka last summer, the Queenslander made 204 runs at 68 compared to the Victorian’s 69 runs at 23. A small sample size, no doubt, but also worthy of mention.
Harris was given a decent crack at Tests, playing nine matches in nine months. Burns deserves to get similarly generous opportunities over the next year to try to prove, once and for all, whether he can become a long-term Test cricketer.
Ben
Guest
I am still on Bancroft over Burns. Test match numbers...... Burns scores many runs v Sri Lanka, West Indies, failed against SA in SA where Bancroft did well before sandpapergate. Bancroft.... England and SA are the only opponents...quality opening bowlers.... Anderson, Broad, Philander, Ramada.....played abroad 5 of 10tests, and England tour no opener got going. He mentally tough and has test cricketer written all over him. Burns got some great free kicks along the way including 170odd against Sri Lanka when 3 big tonnes were scored in that innings.
Jeff
Roar Rookie
No it's just been a bit of a hobby of mine so I've been inputting scoresheets into my own spreadsheet. But it allows you to look at things in a way that isn't always available through say Cricinfo's Satsguru. Agreed there is always going to be some distortion depending on sample size, but from what I can tell it's not that material in terms of getting a form line, and not outs always are always an influence, as they always have been in career averages. I'd like to get some deeper analysis happening for example just looking at top 6 (or maybe top 7) comparisons, but that's another level of work again.
DaveJ
Roar Rookie
Great point Jeff, in fact I think the differential between the player average and the team average runs per wicket is key: unless it’s a very big sample, % of runs can be boosted by not outs and short innings, e.g. getting 50 when chasing 2/130 to win. Is there an online database that makes these figures easy to compute or did you have to enter in the individual scores and team totals separately?
Jeff
Roar Rookie
I posted this yesterday, but will repeat for this discussion. It's a batsman's career runs as a % of the team's total scores across his career (but only when he has batted in the innings), as well the team's average (so total runs divided by total wickets) but again only when that batsman has played. Taking the two incumbent batsmen - Burns and Head - Head has a marginally better career average by 2 runs, though the % of his team's runs is scored is materially better. But it's the differential in the team average vs the player career average that I think is most telling re how important Head's contributions have actually been. Of course, stats don't tell us whether one player was playing in a team of better batsmen, or against a team of weaker bowlers, or in good or difficult batting conditions. But I think the use of side-by-side metrics provides a more useful indication than jut the career average for example. % of team runs, (Test career ave), Aust team innings ave – Head 15.2%, (ave 42.26), 29.74 – Burns 12.6%, (ave 40.11), 43.18 – S Marsh 11.8%, (ave 34.11), 30.43 – Harris 8.6%, (ave 24.06), 30.56 – Bancroft 8.0%, (ave 26.24), 40.43
DaveJ
Roar Rookie
Fair point. Maybe a useful angle would be to look at the percentage of runs scored by the team in matches played, as long as the number of games makes a big enough sample.
Don
Roar Rookie
I think the other variable in comparing runs in an away Ashes series against run in Tests or Shield matches here is the Dukes ball. I wonder if there was any noticeable difference in batsmen’s performances when we started using the Dukes ball in the second half of the last Shield season?
Jeff
Roar Rookie
No I'm not saying that at all. I'm saying there isn't a perfect formula and it's a judgement call based on multiple factors. Shield careers are absolutely relevant to get them in the conversation of Test selection. Their Test careers as they stand are developing and is difficult to draw any firm conclusions from stats (though you can start to get a feel for form lines re certain metrics, though weighted by other considerations). I think the likes of Burns, Harris, Bancroft are all thereabouts in terms of locking down medium-term Test careers; but it's still "watch and act" for a while for all of them IMO until they perform in a variety of circumstances.
Steele
Roar Rookie
Wow great article, I have wondered about Harris’s purple patch not translating to playing for Australia. Great analysis, how you found those numbers is beyond me?! I would like to see the bowlers equivalent now. Jackson Bird seems to dominate yearly and have wondered if he is really that good. No doubt he has benefited. Victoria have a swag of good quicks, I’d like to see their away records as they are pretty good already playing on the Melbourne roads. Patto didn’t do his chances any good this yr bending his back not to mention his potty mouth! But he seriously would be a handful if he moved to Brisbane. He is a class above Neser and look what he is doing. Burns averages 40 for state and country yet gets the arse regularly. The only other opener with that record is Warner (and Usman if you count his brief tenure in that position). Just don’t understand the that debate, until he underperforms then the position should be his. The bonus being, he actually like’s Warner!
matth
Roar Guru
So to be clear you’re saying their test careers are too small and their shield careers are not relevant enough. So then where do you go?
Jeff
Roar Rookie
Don't disagree. But Test is a step up and we've seen a number of batsmen with compelling FC averages driven from domestic outputs not always make it at Test level. So Test analysis (not purely averages of course for reasons discussed) still remains a relevant consideration.
Rellum
Roar Guru
A couple of greener decks and a bunch of easy batting ones hardly qualifies vastly different pitch conditions
matth
Roar Guru
Tremain has been seriously unlucky. He would definitely let nobody down.
matth
Roar Guru
Plus over 40 average in tests, which count towards his first class stats.
matth
Roar Guru
But in his recent tests he made two thirds of stuff all. Why is that forgotten. 9 tests in 9 months to average under thirty.
matth
Roar Guru
Which is why their first class averages, which cover plenty of matches, should be considered. Ronan had those in his article.
Jeff
Roar Rookie
% of team runs, (Test career ave), Aust team innings ave - Head 15.2% (ave 42.26), 29.74 - Burns 12.6% (ave 40.11), 43.18 - S Marsh 11.8% (ave 34.11), 30.43 - Harris 8.6% (ave 24.06), 30.56 - Bancroft 8.0% (ave 26.24), 40.43
Jeff
Roar Rookie
I wholeheartedly support Burn's selection. And I think Ronan is right on the money re differentiating between Shield venues where Burns likely has had a tougher run. But I think you're falling into that trap of using a small sample size of players' careers and ignoring the strength of opponents and the venues where they have played when both players have very different exposures. By way of example (and yes, a batsman's singular performance clearly impacts on team scores, but not to this extent...) these are Australia's first innings team scores of Burns' first 10 Tests right up to the tour of SL that saw him dropped: 530 v India (H) 572/7d v India (H) 556/4d v NZ (H) 559/9d v NZ (H) 224 v NZ (H) 583/4d v Windies (H) 551/3d v Windies (H) 176/2 v Windies (H) 562 v NZ (A) 505 v NZ (A) So clearly, be it venue or opponent, the situation was favouring the Australian batsmen and so you must expect that any batsman will be in a position to establish a decent average (Burns had 2 centuries and 2 half centuries in those ten innings). The Australian first innings scores for Harris' 8 Test career have been: 235 v India (H) 326 v India (H) 151 v India (H) 300 v India (H) 323 v SL (H) 534/5d v SL (H) 179 v Eng (A) 497 v Eng (A) 225 v Eng (A) For a variety of reasons, but not just isolated to Harris, the team scores show batting was that much more difficult across the board. This is why I dislike direct averages comparison between two players where neither player has a large enough sample size to truly "average" out their careers across comparable situations to date.
qwetzen
Roar Rookie
@mickey It's pretty pointless to do now as it takes too many seasons for a player to accumulate a reasonable number of games on the Test pitches.
qwetzen
Roar Rookie
@Gee Neser having a batting average of 27.2 ("on a green demon") compared to Tremain & Bolands low 13s & ("on uber-flat roads") may have something to do with that. Copeland is a very useful Shield player, but I assume the NSP prefers fast bowlers who are capable of bowling a half-decent bouncer.
qwetzen
Roar Rookie
The ABC has been ignoring cricket for many years now. Actually, make that decades. I don't think they've gotten over losing the rights to Kerry Packer in the 1970s...