In previous articles I have been looking at our great bowlers and their performances in Test match wins.
In this article I will reveal the best bowlers and combine with my previous series on the batting side of things to produce our ‘best’ teams in wins, losses and draws.
See my previous articles for detailed discussion of the batting performances.
Remember that the Peer Difference Percentage is a comparison of how a player performed in wins, losses and draws compared to the other batsman and bowlers in those same games.
The Victors (i.e. best performers in wins, minimum ten matches)
Sid Barnes (batting average 70.76, Peer Difference Percentage +14.8%)
Bill Ponsford (62.83, +18.1%)
Don Bradman (130.08, +182.8%)
Steve Smith (81.0, +56.5%)
Greg Chappell (70.49, +64.1%)
Adam Voges (153.85, +143%)
Adam Gilchrist (54.83, +2%)
Alan Davidson (bowling average 16.04, Peer Difference Percentage +26.76%, wickets per test 5.56)
Dennis Lillee (18.27, +24.80%, 6.55)
Graham McKenzie (19.49, +27.54%, 6.22)
Bill O’Reilly (14.95, +25.58%, 6.5)
This is a well balanced attack.
Lillee provides the unparalleled strike rate, Davidson and O’Reilly suffocate the opposition while still taking wickets and McKenzie provides a mix and plenty of wickets per Test.

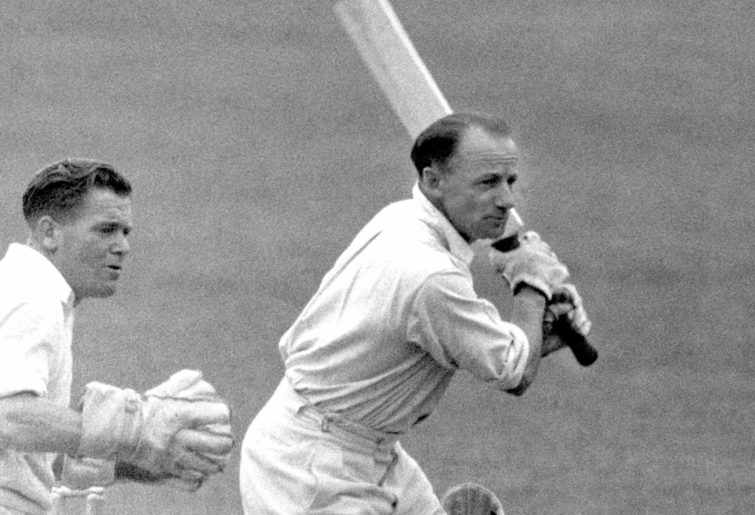
Donald Bradman. Decent batsman. (PA Images via Getty Images)
If there is a spinning pitch we could throw Keith Miller in at 6, then Clarrie Grimmett or Hugh Trumble could replace McKenzie.
Aside from Grimmett and Trumble, those bowlers unluckiest to miss out include old time all rounders George Giffen and Monty Moble, the metronomic twins Glenn McGrath and Stuart Clark for overall excellence and English Bogeyman Mitchell Johnson for pure strike power. Remember this is solely for performances in wins.
The Burning Deck Team (i.e. best performers in defeats, minimum 10 matches)
Victor Trumper (batting average 41.52, Peer Difference Percentage +65.2%)
Bill Lawry (35.58, +29.1%)
Don Bradman (43.27, +58.0%)
Stan McCabe (36.36, +35.7%)
David Warner (37.22, +61.9%)
Steve Waugh (37.77, +45.4%)
Tim Paine (28.36, +13.4%)
Mitchell Starc (bowling average 29.72, Peer Difference Percentage +17.43%, Wickets per Test 4.15)
Hugh Trumble (23.86, +12.00%, 4.18)
Glenn McGrath (23.89, +29.43%, 4.35)
Rodney Hogg (22.25, +35.80%, 4.25)
Rodney Hogg comes in from outside my previous articles. In a weak team he kept his side competitive and for a short time was a simply great bowler.
Mitchell Starc’s strike rate of 49.8 is brilliant, McGrath is his usual self with an excellent average and economy rate. Hugh Trumble just shades Shane Warne by a bare margin.
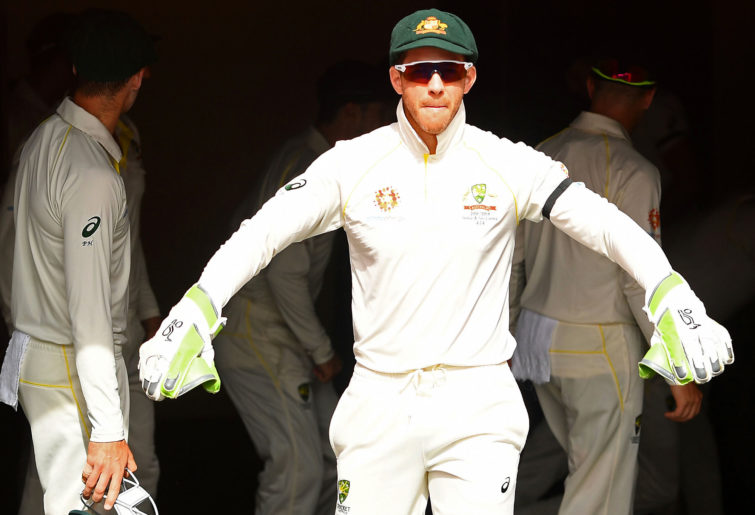
Tim Paine (Photo by Quinn Rooney/Getty Images)
Interestingly, if these three extra bowlers had just lost one or two more matches they would have been the pace attack in this line up: Alan Davidson (8 losses – 17.13 bowling average), Keith Miller who obviously could slot in the top 6 (9 losses – 22.08) and Pat Cummins (9 losses – 22.33 bowling average and 44.8 strike rate).
Other players who were close include 19th Century star Charles ‘Terror’ Turner, Western Australian swing man Terry Alderman, current star Josh Hazlewood, the legendary DK Lillee and cult hero Mervyn Hughes.
The Stalemate Team (i.e. best performers in draws, minimum 10 matches):
Charles Macartney (batting average 77.0, Peer Difference Percentage +117.10%)
Arthur Morris (63.94, +44.2%)
Don Bradman (111.9, +135.4%)
Michael Clarke (75.66, +57.1%)
Allan Border (68.7, +62.2%)
Mike Hussey (64.63, +44.2%)
Brad Haddin (52.5)
Richie Benaud (bowling average 32.52, Peer Difference Percentage +12.07%, Wickets per Test 3.52)
Ray Lindwall (27.84, +21.77%, 3.42)
Jeff Thomson (24.07, +28.57%, 4.42)
Bruce Reid (27.03, +45.34%, 3.56)
Again Shane Warne just misses out, this time to Richie Benaud. Thommo’s stats in draws are simply outstanding and Reid was a huge distance ahead of his peers. Lindwall provides the consistency.
Other bowlers unlucky to miss out include wonky legged workhorse Max Walker, yet again the ultra-consistent Alan Davidson, Dennis Lillee again, Garth McKenzie, 1990s attack leader Craig McDermott and speed gun breaker Brett Lee.
The only bowlers to be mentioned in all three categories are Alan Davidson and Dennis Lillee. Others like spinners Bill O’Reilly, Clarrie Grimmett, Hugh Trumble and current star Pat Cummins, would also have that honour except that they haven’t played at least 10 games in each category.
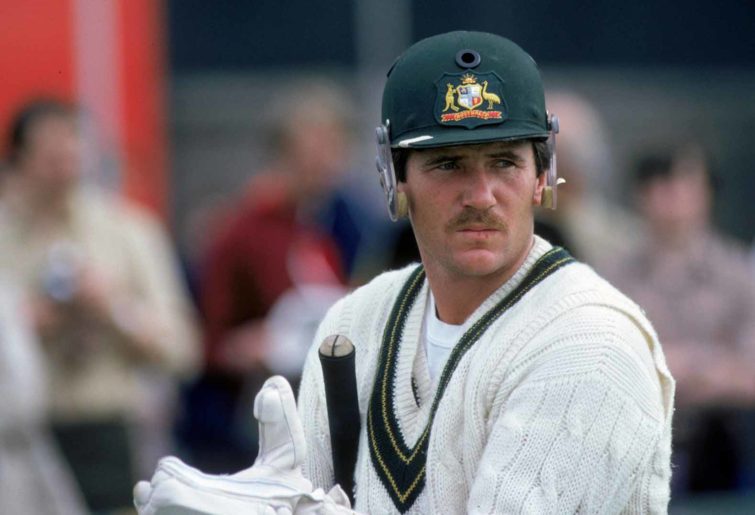
Allan Border (Adrian Murrell/Getty Images)
It’s difficult to come up with a Rest of the World Victors XI just based on raw batting and bowling averages, etc without doing the full Peer difference Percentage Analysis, as averages over time and in different countries are just too variable.
But if I had to do it, using a balance between winning averages, wickets per Test and high numbers of wins, it might be something like this:
Jack Hobbs (ENG) (batting average 68) – 28 wins
Saeed Anwar (PAK) (66.29) – 23 wins
Kumar Sangakkara (SL) (71.69) – 54 wins
Younis Khan (PAK) (74.39) – 46 wins
Inzamam-ul-Haq (PAK) (78.2) – 49 wins
Garfield Sobers (WI) (75.35) – 31 wins. Plus a bowling average in wins of 24.04 and 3.4 wickets per test.
Andy Flower (ZIM) (84.5) (but only 7 wins), otherwise Sanga takes the gloves and we add Kane Williamson (71.36) – 33 wins.
Imran Khan (PAK) (bowling average 14.5, wickets per test 5.96) – 26 wins. Plus a batting average in wins of 36.0.
Richard Hadlee (NZ) (13.06, 7.86) – 22 wins. Plus a batting average in wins of 30.38.
Sid Barnes (ENG) (13.58, 8.85) – 13 wins
Muttiah Muralitharan (16.18, 8.11) – 54 wins.
Other very, very strong contenders would be England’s 19th Century star George Lohman (bowling average 9.67, 6.27 wickets per test – 15 wins), New Zealand’s brilliant but injury prone Shane Bond (14.81, 6.5 – 10 wins), old time slow left armer Johnny Briggs (13.01, 4.42 – 19 wins) and famous English offspinner Jim Laker (13.65, 5.32 – 19 wins). You could also throw in fiery South African quick Dale Steyn (16.6, 6.35 – 48 wins) and also Malcolm Marshall (16.78, 5.91 – 43 wins) and Curtley Ambrose (16.86, 5.2 – 44 wins) as the best of the West Indian pace battery.
Just a quick note on one of my favourites: Richard Hadlee only tasted victory 22 times in his career and they mostly came from his outstanding performances, taking 173 wickets at a bowling average of 13. In those wins Hadlee took 10 wickets in a match 8 times from 22 wins and 5 wickets in an innings 17 times. Throw in 790 runs at 30.4 and Hadlee was the winner for New Zealand.
And let’s also celebrate the great Imran Khan. Those numbers above are extraordinary, given he was often bowling in sub-continental conditions. Three of our top 6 batsmen are from Pakistan, which likely indicates batting was an easier business and yet Imran took 6 ten wicket match hauls and 11 five wickets in an innings in only 26 wins.
Next time in the final article I will try to see if this win contribution analysis can provide any additional insights into our great allrounders.
Once Upon a Time on the Roar
Roar Guru
Michael Clarke’s high average in draws suffers from his 259 not out v saffies in Brisbane 2012-13 and 187 v England Old Tafford, both of which would have been wins but for large amounts of rain as well as his 230 in Adelaide v saffies 2012-13 that should have been won but for incompetent catching by Wade behind the stumps.
All day Roseville all day
Roar Guru
When you name an "Insatiable XI" of those who reach three figures (in articles), then take a fresh guard and aim for 200- make yourself captain !
matth
Roar Guru
Go for it :happy: . I’ve one more in this series then I’m heading into the same analysis for ODI’s
All day Roseville all day
Roar Guru
:stoked: :stoked: :stoked: I'm just desperately looking for ways to justify so many lunchtimes, evenings and weekends spent on this site... please keep it coming ! Plus I'm starting to think that Renato Carina had something, when he divided up Victor Trumper's innings based on match situation- First innings Second innings- in reply Third innings- when already leading Third innings- when in deficit Third innings- when following on Fourth innings- when chasing a target
matth
Roar Guru
Thanks Barry
matth
Roar Guru
Let's just say that marketing is not my strong suit. Originally had "The Bullies", "The Losers" and the "Not-Winners".
matth
Roar Guru
To be honest, you can’t use this constructively, it can only ever be a hindsight overlay and a bit of fun. It just tells you who put the foot on the throat when on top, who didn’t give up when a loss was likely and who kept charging in on a lifeless pitch. However, to make this more robust you’d likely want to exclude the first innings from the losing and draw categories (whether batting or bowling – the second innings of the four innings match is fine because the tenor of the game is starting to develop). Then these first innings night be useful to add to the winning stats, because at that time the players are still very much in the winning mindset.
Tony
Roar Guru
Another great read and piece of analysis Matt.
All day Roseville all day
Roar Guru
"The Victors," "The Burning Deck Team" and "The Stalemate Team." Matth, are you the one who came up with all the new marketing terms in the BBL ? Power Surge, Bash Boost etc ? :stoked: :stoked: :stoked:
All day Roseville all day
Roar Guru
Thanks matth, But working out how to apply this analysis, is doing my head in ! As you can't know at the start of a match whether it will end in a win, draw or loss, how can you use the information constructively ? Except to help when a draw will be enough to retain a trophy, or a win is needed to regain or retain it ? As I suggested once before, the logical conclusion is that it always pays to pick a balanced team that won't fall apart in unforeseeable situations. A Slater for every Taylor, a Reiffel for every Tait, and a workhorse or decent fifth bowler in case someone gets hurt.
matth
Roar Guru
Warne’s consistency maybe worked against him, in that he was int he top four or so in each category. If you go. Back to my article assessing the spinners, Warne’s raw stats and comparison to peers was behind each of O’Reilly, Grimmett and Trumble. Benaud has great draws stats but not as good elsewhere. At the time my theory is that because Warne had such great control, he was often used as a stock bowler on unresponsive pitches, even when he wasn’t as much of a threat. This actually makes his figures worse.
matth
Roar Guru
I agree. If you raise the cut off in wins to, say 20, you replace Voges, Barnes and Ponsford in the win team, with Steve Waugh, Bob Simpson and Victor Trumper. In gut feel that possibly strengthens the team. But I wasn’t trying for best of all time, but just to highlight who produced the output in each game situation.
Micko
Roar Rookie
No batting depth behind them. Even now the only clear cut player from there that has matured and emerged as a genuine Test star is Labuschagne.
Tony Hodges
Roar Rookie
They were definitely champions, but I don’t think the team was a champion one
Micko
Roar Rookie
Am also surprised that Warne is overshadowed by other spinners in all three categories. Was certain that Warne would be in at least one of these teams.
Micko
Roar Rookie
I was surprised by Warner making the losses side, but then I remember that standout fighting century he made in Hobart when we lost to NZ by about 7 runs. The stats accrued on that loss alone for him would've been huge as both teams struggled to pass 200 in their innings, and hardly any batsman got near 50 on that lush greentop.
Micko
Roar Rookie
We found that out a couple of years ago: no Smith & Warner = India's first series win in Australia.
Paul
Roar Guru
Matt, I know this is going to sound strange, but I'd back the Burning Deck team to beat the Victors any way of the week. I can't see a weakness in the losers team but the obvious standout in the other side is Adam Voges. He's clearly a very good player, because the numbers say so, but is in the same class as the other guys around him? I think he'd be the first to admit he's not. Thanks again for another really good piece.
matth
Roar Guru
Yes Voges and Barnes have just 10 wins each (and Ponsford 16), but once I set the 10 match cut off I stuck with it. In the middle order the next in line is Steve Waugh, with Doug Walters after him. For openers there is not as many standouts to choose from. Definitely Bob Simpson if you are just replacing Barnes. The contenders for Ponsford’s spot are Matt Hayden and David Warner on raw average, But then you have Trumper, whose raw stats are behind those other two, but whose Peer Difference was significantly greater – more than enough to take that second spot.
DaveJ
Roar Rookie
I’d be very happy with the RoW bowling attack selected, though I think Imran’s amazing record relates in particular to his record at home - average of 19.8 in Pakistan, 16.8 in his last ten years. Has to be some question marks over the umpiring methinks. I think Barnes’ and Voges’ small number of Tests probably should exclude them, given that you are breaking down those small sample sizes even further. Who would be the next in line for Australia - Trumper?