Numbers! Football! It’s time for our annual dispassionate look at some of the numbers behind the numbers in the AFL and see whether we can jag a bit of signal amidst the noise.
The fourth annual Numbers Game will shed a little bit of light on which teams either over or underperformed their actual win totals in 2018 and therefore suggests who we could reasonably expect to see be a little worse or better than in 2018. We do it with four key metrics:
- Pythagorean wins: The original and the best, Pythagorean wins adjust a team’s win total for their underlying performance as measured by points for and against and for the strength or weakness of their fixture for the year.
- Close games: Teams simply don’t win too many more than half of their close games – games with a margin of 12 points or less – over the long run. If a team went on a hot streak last year, we can reasonably expect a cold streak will follow this year.
- Blowouts: By contrast, teams which blow away their opposition regularly are often better than their record can show us, because it doesn’t matter if you win by ten points or 100 points, it’s only worth one W. The same goes in reverse, by the way.
- Fixture change: Finally, the wonky AFL fixture can influence how many wins a team can gather. Played Gold Coast twice last year but have Richmond twice this year? That matters.
For good measure we’ll add another official category to this year’s game: total list experience. As we’ll discuss, it’s not clear this is a causal statistic, but it certainly tends to correlate to successful teams, so let’s throw it in the pot.
Finally, an additional part statistic: a look at how each team’s fixture difficulty ramps up or down over the year. Temporal fixture difficulty – or TFD; it’s a thing – is more about understanding which teams might have a rough start or charmed run on account of their fixture.
That gives us a nice number of indicators to talk through. Before we do, a word of warning as to the seriousness with which you should view these numbers. They have been about as reliable as the preseason betting markets when it comes to deciding a premier.
Numbers Game profiled the Dogs as a steady-as-she-goes team (which I guess they ultimately were given they finished the home-and-away season in seventh, down from sixth in 2015), thought Richmond would get worse (fortunately I didn’t listen only to the numbers) and figured West Coast would stick around where they were in 2017 (they did not).
However, last year’s Numbers Game did pick Collingwood’s rise, North Melbourne’s improvement and Gold Coast’s further slide and suggested Fremantle wouldn’t get any better. They also said Richmond, Brisbane, Carlton, Geelong and St Kilda would finish around the same mark as they did the year prior. So the metrics are certainly not perfect, but they seem to do the job for a lot of teams and situations.
With that all in mind, let’s go.
Pythagorean wins
Pythagorean wins has fallen deeply in love with the prospects of two teams: the Brisbane Lions (-3.2 wins) and Geelong Cats (-3.8 wins). Both have a Pythagorean plus-minus in excess of minus three, which means if we played the 2018 season over again, each could be reasonably expected to have won at least three more games than they actually did.
That would’ve put the Cats into the top two and have seen the Lions reach eight wins for the first time since 2013. It suggests each of their underlying performances were significantly better than their record showed. And so on this metric they should be better in 2019.
Pythagorean wins has become a bit of a fashionable statistic in some elements of the media, with pieces on Fox Sports and in the West Australian earlier this week. In those, the authors indicated the 2.5 win threshold had been directionally accurate (being a team that was 2.5 wins over its Pythagorean total went backwards, and vice versa) in 12 of 14 instances over the past four seasons. Not bad at all.
Unless you’re Fremantle. The Dockers outperformed their Pythagorean total by a hefty 2.8 wins last year, though that may be due to the team’s penchant for large losses which didn’t quite meet the ‘blowout’ threshold. Fremantle lost nine games by 50 points or more but just three of those games met my blowout number (60 points, which was the average margin plus one standard deviation). The Dockers were an above averagely bad team, but not a horrible one.
The Western Bulldogs meet the 2.5 win outperformance threshold too, although only just and only on account of an adjustment for their fixture. In raw Pythagorean terms – which is what Max from Fox Sports used – the Dogs sneak under.
Other noteworthy Pythag teams include Gold Coast (outperformed by 1.6 wins – yikes) and Melbourne (underperformed by two wins – yikes). In both cases it was a first half/second half thing.
| Wins | Pythag Wins | Difference | |
|---|---|---|---|
| Adelaide | 12.0 | 12.0 | 0.0 |
| Brisbane | 5.0 | 8.2 | -3.2 |
| Carlton | 2.0 | 1.9 | 0.1 |
| Collingwood | 15.0 | 14.3 | 0.7 |
| Essendon | 12.0 | 12.4 | -0.4 |
| Fremantle | 8.0 | 5.2 | 2.8 |
| Geelong | 13.0 | 16.8 | -3.8 |
| Gold Coast | 4.0 | 2.4 | 1.6 |
| Greater Western Sydney | 13.5 | 13.6 | -0.1 |
| Hawthorn | 15.0 | 14.7 | 0.3 |
| Melbourne | 14.0 | 16.0 | -2.0 |
| North Melbourne | 12.0 | 11.6 | 0.4 |
| Port Adelaide | 12.0 | 12.1 | -0.1 |
| Richmond | 18.0 | 17.2 | 0.8 |
| St Kilda | 4.5 | 5.8 | -1.3 |
| Sydney | 14.0 | 13.7 | 0.3 |
| West Coast | 16.0 | 14.8 | 1.2 |
| Western Bulldogs | 8.0 | 5.5 | 2.5 |
Close games
One factor that explains why a team may not live up to its Pythagorean win total is its performance in close games. You’ve heard it before, but for newcomers, first off, welcome, and second, every team’s performance in close games regresses to the mean in the long run. So if a team wins a clutch of close games in any given year, it’s reasonable to expect they’ll drop a few in subsequent years.
This is far and away the biggest factor behind Brisbane’s underperformance against its Pythagorean total. The Lions played seven games that were decided by 12 points or less in 2018 and won just one of them. Over the long run you’d expect them to win 3.5 of seven, meaning they were about 2.5 games underweight. Should the Lions play in seven close games this year and win six of seven – which would take them to an even 7-7 over two years, the mean expectation – they will play finals.
A few other teams were under or overweight on close games by more than half a game. Adelaide pinched an extra one (5-3), Gold Coast lost an extra one (1-3), Hawthorn nabbed two (6-2), Melbourne missed 2.5 (going 0-5, ouch) while Richmond and West Coast’s win totals got a 1.5 game boost (both 4-1).
Regular readers will notice a team is missing from the discussion: the Geelong Cats. For as long as the Numbers Game has been going, the Cats have been the one team to blow up the theory of close game mean regression. Between 2014 and 2018 the Cats were an obscene 17-2-2 in games decided by less than 12 points, including a streak of 12 home-and-away season games (from Round 3 2014 to Round 13 2016) where they didn’t lose a close one.
Well, mean regression may finally be kicking in. Geelong was 3-4 in close games in 2018, or 0.5 games under their expected close game total. It marked the first time since 2013 Geelong had been under its close win tally – that’s five straight seasons against the maths. That’s not supposed to happen. Out of interest, the Cats were 43-2-32 in close games from 2000 to the beginning of that streak in 2014 for a win percentage of 55 per cent. That’s historically normal (every team is between 45 per cent and 55 per cent in the long run); what they did between 2014 and 2018 was not.
| Blown out | Blowout | |
|---|---|---|
| Adelaide | 1 | 1 |
| Brisbane | 1 | 1 |
| Carlton | 7 | 0 |
| Collingwood | 0 | 2 |
| Essendon | 1 | 0 |
| Fremantle | 3 | 0 |
| Geelong | 0 | 4 |
| Gold Coast | 7 | 0 |
| Greater Western Sydney | 1 | 3 |
| Hawthorn | 0 | 3 |
| Melbourne | 1 | 4 |
| North Melbourne | 1 | 1 |
| Port Adelaide | 0 | 0 |
| Richmond | 0 | 4 |
| St Kilda | 1 | 1 |
| Sydney | 0 | 1 |
| West Coast | 0 | 1 |
| Western Bulldogs | 2 | 0 |
Blowouts
Once more for the uninitiated: the presence of multiple blowout margins (the average margin plus one standard deviation, which in 2018 was worth 60 points) in a single season has historically been a sign that a team’s ladder position may not have reflected its underlying strength or weakness.
In 2018 a number of teams had a handful of blowout victories: Richmond (four), Melbourne (four), Geelong (four), Greater Western Sydney (three) and Hawthorn (three). Of those teams the Cats, Hawks and Tigers kept a clean sheet the other way. Chalk up another positive underlying indicator for the hoops.
Going the other way were Carlton (seven!), Gold Coast (seven!) and Fremantle (three). However, it’s not all bad news. History shows teams have been able to turn around their tendency to concede blowouts relatively quickly, and it has tended to correlate with improved performance (as you may expect). For instance, Brisbane had conceded six, seven and five blowout losses in 2015 through 2017 respectively; they conceded just one in 2018, and while the ladder wins didn’t flow the team’s Pythagorean wins, they went through the roof (4.4 in 2017 to 8.2 in 2018).
| Close Wins | Close Games | Difference (on 50-50) | |
|---|---|---|---|
| Adelaide | 5.0 | 8.0 | 1.0 |
| Brisbane | 1.0 | 7.0 | -2.5 |
| Carlton | 0.0 | 1.0 | -0.5 |
| Collingwood | 2.0 | 3.0 | 0.5 |
| Essendon | 1.0 | 3.0 | -0.5 |
| Fremantle | 2.0 | 4.0 | 0.0 |
| Geelong | 3.0 | 7.0 | -0.5 |
| Gold Coast | 1.0 | 4.0 | -1.0 |
| Greater Western Sydney | 2.5 | 4.0 | 0.5 |
| Hawthorn | 6.0 | 8.0 | 2.0 |
| Melbourne | 0.0 | 5.0 | -2.5 |
| North Melbourne | 3.0 | 7.0 | -0.5 |
| Port Adelaide | 3.0 | 7.0 | -0.5 |
| Richmond | 4.0 | 5.0 | 1.5 |
| St Kilda | 2.5 | 4.0 | 0.5 |
| Sydney | 5.0 | 9.0 | 0.5 |
| West Coast | 4.0 | 5.0 | 1.5 |
| Western Bulldogs | 4.0 | 7.0 | 0.5 |
Fixture difficulty change
Our uneven fixture will always produce winners and losers but it won’t be clear until at least halfway through the season who is truly benefitting. For now we can use last year’s underlying performances as a guide to who may have things a little easier or tougher than they had it a year prior.
Here the preliminary winner is clear: St Kilda’s fixture has gone from far and away the most difficult (with an average opponent Pythagorean win total of 12.1) to least difficult (10.4). It will come as a relief to Saints fans, who’ve seen their team play challenging fixture after challenging fixture for the past four seasons. It’s also an early win for the team’s new off-field analytics crew who I know had raised this with HQ as the fixture was being arranged last year.
Other beneficiaries are Gold Coast (11.4 wins to 10.8 wins) and the Western Bulldogs (11.3 wins to 10.9 wins). Most other teams have seen their fixture difficulty change by 0.2 wins or so.
However, a number of teams have seen their fixture difficulty ramp up meaningfully, principal among them Collingwood. The Pies finished 13th in 2017, meaning they benefitted from the league’s weighted rule. As a result the defeated grand finalists played a fixture with an average opponent win total of 10.4 wins, the second-least difficult in the competition. In 2019 the Pies’ average opponent has a 2018 win total of 11.3 wins, the second-highest in the competition.
North Melbourne has also been smacked by the weighted rule stick, albeit less justifiably given the club finished ninth. The Roos had the least difficult fixture in 2018 (average opponent wins of 10.1), and they’ve got the most difficult in 2019 (average opponent wins of 11.4).
While an important early indicator, it can certainly be a bit misleading. This time last year we said West Coast would have the third-most difficult fixture; it turned out to be the third-least difficult. Similarly, Gold Coast projected to have the second-least difficult fixture; it turned into the third-most difficult. Melbourne (eighth-most difficult, became second least difficult) and Sydney (fifth-least difficult, became second-most difficult) also showed this isn’t an exact science. We’ll check in halfway through the year.
| 2018 (actual) | 2019 (projected) | Change | |
|---|---|---|---|
| Adelaide | 11.2 | 10.8 | -3.6% |
| Brisbane | 11.2 | 10.7 | -4.2% |
| Carlton | 10.7 | 10.9 | 2.2% |
| Collingwood | 10.4 | 11.3 | 9.2% |
| Essendon | 11.3 | 11.1 | -2.1% |
| Fremantle | 11.3 | 11.1 | -1.9% |
| Geelong | 11.1 | 10.8 | -2.7% |
| Gold Coast | 11.4 | 10.8 | -5.2% |
| Greater Western Sydney | 10.9 | 11.1 | 2.5% |
| Hawthorn | 10.9 | 11.3 | 3.3% |
| Melbourne | 10.2 | 11.3 | 10.4% |
| North Melbourne | 10.1 | 11.4 | 12.9% |
| Port Adelaide | 10.7 | 10.9 | 1.8% |
| Richmond | 11.0 | 10.8 | -1.4% |
| St Kilda | 12.1 | 10.4 | -13.5% |
| Sydney | 11.6 | 11.1 | -4.2% |
| West Coast | 10.6 | 11.2 | 5.2% |
| Western Bulldogs | 11.3 | 10.9 | -4.0% |
Team change
As above, it’s not clear this is a causal statistics. As the lads and I found in the excellent Australian Rules football book Footballistics there is a clear correlation between team experienced – and shared experience – and success, but there is certainly no causal link. Does experience beget success or success beget experience? Who knows.
But the correlation is still interesting. Given that, who has the most experience in the league?
| Games experience | Rank | |
|---|---|---|
| Adelaide | 3,141 | 6 |
| Brisbane | 2,603 | 13 |
| Carlton | 2,493 | 17 |
| Collingwood | 3,628 | 2 |
| Essendon | 2,593 | 14 |
| Fremantle | 2,625 | 11 |
| Geelong | 3,201 | 3 |
| Gold Coast | 2,307 | 18 |
| Greater Western Sydney | 2,925 | 9 |
| Hawthorn | 3,696 | 1 |
| Melbourne | 2,604 | 12 |
| North Melbourne | 2,905 | 10 |
| Port Adelaide | 3,167 | 5 |
| Richmond | 3,131 | 7 |
| St Kilda | 2,550 | 16 |
| Sydney | 3,178 | 4 |
| West Coast | 3,098 | 8 |
| Western Bulldogs | 2,591 | 15 |
Perhaps unsurprisingly, Hawthorn continues to top the league table for AFL games on its list with 3696 games. However, Collingwood is rapidly approaching it, with 3628 games. The Pies have built considerable experience over the past four years, going from 2719 games at the start of the 2016 season to its current tally.
Down the other end is Gold Coast (2307 games), which is the fewest games any team has had on its list since the Brisbane Lions of 2017. Those Lions have now built all the way up to 2603 games, placing them 13th overall.
There’s also a clutch of teams with around 3000 games of experience on their list: Sydney, Port Adelaide, Adelaide, Richmond, West Coast and the GWS. Again, this may mean everything or nothing, it’s not clear, but history suggests teams with around this level of experience on their list are those which tend to make finals and win premierships.
You know what else is interesting? We have eight teams with at least 3000 games of experience on their lists heading into the season. That’s double the number of the 2016, 2017 and 2018 seasons. A whole heap of teams are going for broke, but unfortunately (unless the AFL also changed this rule in the off-season) there can only be one winner. There’ll be some disappointed boards out there.
Fixture ramp-up
One thing that is always difficult to parse is how much we should read into any team’s first four to six games. Early season predictions have been kind to this column in recent years, having noted the Dogs, Tigers and Eagles’ starts were all a sign of their potential to contend for a premiership. But often a team’s hot start can be put down to who it has played.
Here’s what every team’s first six weeks looks like in terms of average opponent Pythagorean win total, remembering that most teams have a season-long average of pretty much 10.9 to 11.1 wins.
| First six | Full season | |
|---|---|---|
| Adelaide | 10.8 | 10.8 |
| Brisbane Lions | 11.2 | 10.7 |
| Carlton | 10.9 | 10.9 |
| Collingwood | 12.5 | 11.3 |
| Essendon | 11.6 | 11.1 |
| Fremantle | 8.9 | 11.1 |
| Geelong | 14.2 | 10.8 |
| Gold Coast | 6.4 | 10.8 |
| Greater Western Sydney | 13.3 | 11.1 |
| Hawthorn | 8.9 | 11.3 |
| Melbourne | 13.0 | 11.3 |
| North Melbourne | 10.8 | 11.4 |
| Port Adelaide | 11.6 | 10.9 |
| Richmond | 11.9 | 10.8 |
| StKilda | 10.4 | 10.4 |
| Sydney | 11.0 | 11.1 |
| West Coast | 11.7 | 11.2 |
| Western Bulldogs | 8.7 | 10.9 |
Whoo boy. Geelong’s average opponent in the first six weeks has a win total of 14.2 wins, far and away the highest in the competition. Its opening slate includes Collingwood, Melbourne, Adelaide, GWS, Hawthorn and West Coast. That, folks, is the stuff of nightmares, particularly if the Crows rebound in the manner most seem to expect they will (and which they’re certainly capable of doing).
The Giants (13.3) and Melbourne (13 even) also figure to have tough starts to the season befitting their status as premiership contenders.
Way down the other end of the spectrum is the Gold Coast Suns, who the AFL has undoubtedly looked after in fixturing an average opponent win total of 6.4. We can look at this in one of two ways: the Suns get off to a decent start and win between two and four of their first six and then sort of fade into the background as the usual types start crisis-mongering. Equally, the Suns could stink and lose the lot, and suddenly we’re faced with a real crisis.
The Western Bulldogs (8.7 wins), Hawthorn (8.9 wins) and Fremantle (8.9 wins) also have fixtures amenable to a fast start. If they can make the most of it, it’ll set them up for a push to the eight – which at this early stage I think is well within the realms of possibility for each of them – thereafter.
The so what
This is something I am increasingly conscious of when it comes to these sorts of columns. That’s a lot of numbers – so what? Here’s the summary. Brisbane has a net three positive indicators (three positive, no negative), which suggests their 2019 will be better than 2018. Geelong is sitting at a +4 on the five-indicator ledger, the Cats having four pluses and no minuses. Heaps of teams have a net +2. At the other end of the table West Coast is one of five teams with a net -2. When you win the premiership I guess there’s not really another direction to go, right?
Here is the 2019 AFL Numbers Game.
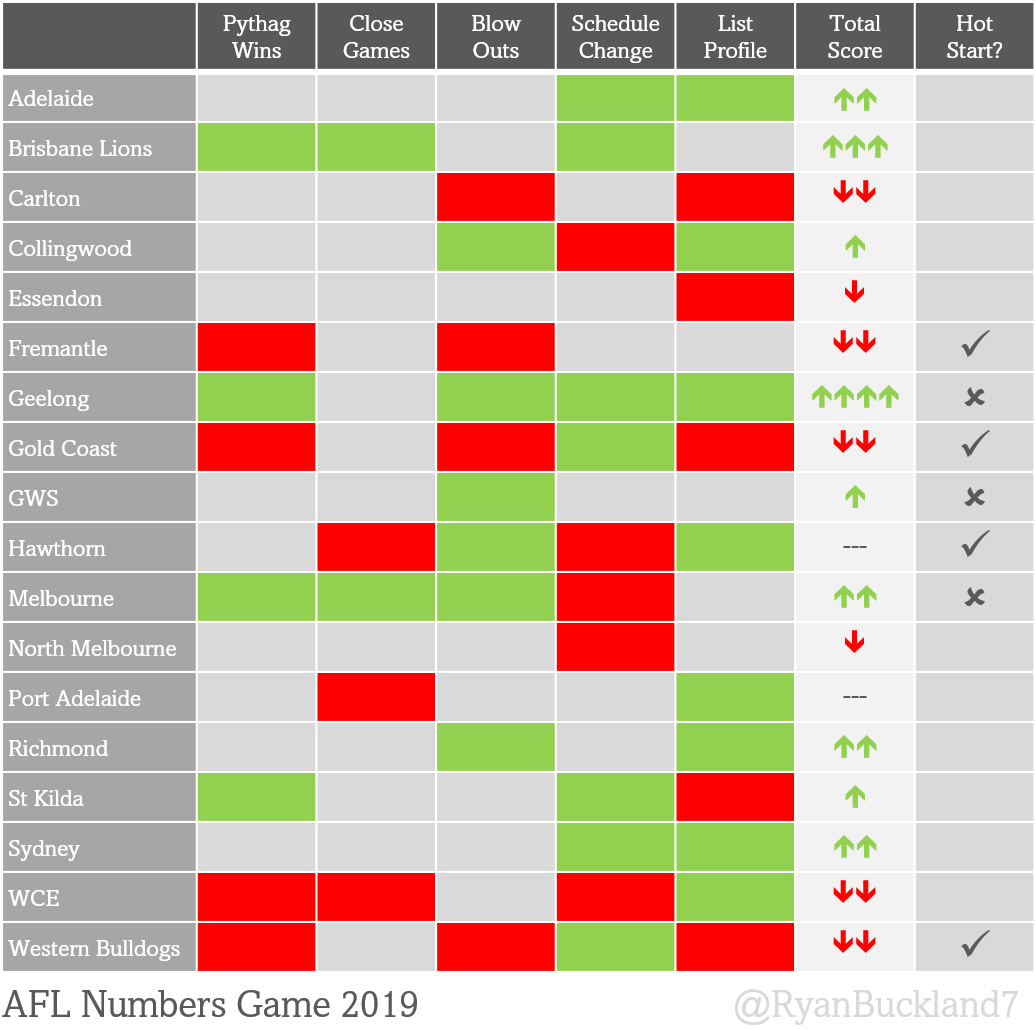

The takeaway is confirmation the Lions find themselves in a strong starting position to make a leap in 2019. Equally, the pessimism towards Geelong may be a little overplayed, even if I can see the qualitative reasons we might expect a little slide from the Cats.
And with the Numbers Game in the books, we can start to get a little more funky with our preseason look ahead as we move within six weeks of opening night.
DingoGray
Roar Guru
Oh how footy season is near, I love this stuff Ryan! Cracking read. I'm just hoping it stack up for the Lions sake.
Peter the Scribe
Roar Guru
Hey Ryan, we just lost a flag by a kick after leading for 90% of game time - close game results are unpredictably brutal.
Peter the Scribe
Roar Guru
Looking forward to your article Jonboy, whats the topic?
Don Freo
Roar Rookie
You never made that claim. You had quite different numbers. Basically, you lie and when corrected, run to another article.
Dalgety Carrington
Roar Guru
The last word or not is immaterial. It's that you use it as nothing more than a tactic and flimsy cover. Just like your insubstantial post immediately above. You're unable to show that your posts aren't as described, so you try the old "nah, but you are" deflection trick.
Jonboy
Roar Rookie
If it really does worry you not to have the last say, i will leave at that i will let you have the last one, boohoo.
Dalgety Carrington
Roar Guru
Nice slice of your usual negative shammery anonboy. You just have to get the last word in, eh? It's a real giveaway to the fact you squirm at any scrutiny. - Whether it's slipping on the old sock puppet or pure copy and pasting an old comment as some sort of decoy answer. XD - Don't like the answer, so out comes the ducking and dodging and cheap tricks. - Was there not some expression of interest in how experience works out across a list? I'm assuming it wasn't just another sham post.
Jonboy
Roar Rookie
Don Freo like a dog at a bone on injuries, Dalgety ages, percentages and continual waffle. These blokes continue with these excuses for Freo's poor performances and stagnant position in the bottom half. Why like the majority can they not see that Lyon and his assistants have failed miserably. They have been given a good list apart from Sandilands, Ballantyne and Bennell all currently suffering calf injuries (Again). This has to be his last year even though contracted till 2020.
anon
Roar Pro
Those extra 9 games on average is not the reason why Melbourne played prelims and Fremantle became the whipping boy of the comp with 9 beltings. We’ll see how your team goes this year and next. Lyon said he would have failed if he doesn’t have a premiership in 19 months time.
Dalgety Carrington
Roar Guru
XD You can always tell you’re in strife coming up with anything relevant to the point when you pull out the “9 beltings” type stuff. ???? It’s just one of your many desperate attempts to wriggle off the hook tropes. – Oh and I happen to have your high school remedial maths teacher on the line and other than to say keep trying tiger, they wanted to ask are you sure that 12% is a small difference? Based on what? – When looking at results ignoring all other variables, you find that give or take win/loss ratios average out to a 50/50 proposition. However when a team is on the wrong side of a 12% difference in average games experience that win ratio drops to 23.85%. A 50% drop in the likelihood of winning is fairly hefty, but that aint the whole picture. It’ll drop even further if the team averaged less than 75 games experience to a 14.29% win ratio. – So that 12% difference in average games perhaps is fairly significant. Further reading into the averages the Dees played 7 games (won 2 lost 5) where they were on the wrong side of the 12% experience differential, while Freo had it 11 times (won 2 lost 9). On the flipside of that, the Dees got to be on the advantageous side of the 12% ledger 6 times (won 6 lost 0), while Freo got it just once (won 1 lost 0). – I should say at this point that, obviously if you are on the sunny side of the 12% experience differential the winning rate climbs to 76.86%. – Obviously, this doesn’t tell the whole story, but it gives a more comprehensive picture. I’m assuming you were sincere in your stating you found the experience stuff interesting? – To add to the picture, you seem to have forgotten your hobby horse of last year, the number of players with under 50 games experience running out on the park. Melbourne averaged 4.27 u50 players per week, which was actually the second lowest average in the u50 numbers (Don’s pipped it for the lowest at 3.95, while the premiers WC averaged more at 4.82). – Freo, on the other hand, averaged the most across the season with 9.09 (with the Dogs in next at 8.50). Basically, you could think of that like an electricians company trying to compete in a cutthroat market relying on apprentices to make up nearly half of it’s day to day workforce. Of course you’re going to be pushing it up hill. – What the low u50 gamers vs mid-low experience contrast probably shows is that the sheer volume of high draft picks the Dees have had access to over the years has allowed them to stockpile a comparatively large number of high quality 20-24 year olds. So lower on the experience scale, but less need to rely on the newer draftees week in week out. – Food for thought seems as how you’re interested. Didn’t think you’d mind the delay (had a busy weekend ), given curiosity has no deadline.
anon
Roar Pro
Melbourne players only had 9 more games per player than Fremantle according to your metric. According to Ryan’s metric Melbourne is less experienced than Fremantle. These small differences in the make up of the lists aren’t the reason why Melbourne was top 4 and Fremantle were a bad team that were handed 9 beltings.
Lroy
Guest
Given the interstate sides travel every second week anyway, why don't they all just play each other twice every year and the remaining games you just play the Melbourne teams home and away and every second year you play at home. No mess, no fuss, no great ''soy milk in the cheese'' conspiracy theories and everyone can just get onto enjoying watching, and blogging about footy. Unless you are playing of course which would be better but age has a way of catching up with the best of us so blogging is the next best thing.
Dalgety Carrington
Roar Guru
You can always tell you’re in strife coming up with anything relevant to the point when you pull out the “9 beltings” type stuff. :D It’s just one your many desperate attempts to wriggle off the hook tropes. - Oh and I happen to have your high school remedial maths teacher on the line and other than to say keep trying tiger, they wanted to ask are you sure that 12% is a small difference? Based on what? - When looking at results ignoring all other variables, you find that give or take win/loss ratios average out to a 50/50 proposition. However when a team is on the wrong side of a 12% difference in average games experience that win ratio drops to 23.85%. A 50% drop in the likelihood of winning is fairly hefty, but that aint the whole picture. It’ll drop even further if the team averaged less than 75 games experience to a 14.29% win ratio. - So that 12% difference in average games perhaps is fairly significant. Further reading into the averages the Dees played 7 games (won 2 lost 5) where they were on the wrong side of the 12% experience differential, while Freo had it 11 times (won 2 lost 9). On the flipside of that, the Dees got to be on the advantageous side of the 12% ledger 6 times (won 6 lost 0), while Freo got it just once (won 1 lost 0). - I should say at this point that, obviously if you are on the sunny side of the 12% experience differential the winning rate climbs to 76.86%. - Obviously, this doesn’t tell the whole story, but it gives a more comprehensive picture. I’m assuming you were sincere in your stating you found the experience stuff interesting? - To add to the picture, you seem to have forgotten your hobby horse of last year, the number of players with under 50 games experience running out on the park. Melbourne averaged 4.27 u50 players per week, which was actually the second lowest average in the u50 numbers (Don’s pipped it for the lowest at 3.95, while the premiers WC averaged more at 4.82). - Freo, on the other hand, averaged the most across the season with 9.09 (with the Dogs in next at 8.50). Basically, you could think of that like an electricians company trying to compete in a cutthroat market relying on apprentices to make up nearly half of it’s day to day workforce. Of course you’re going to be pushing it up hill. - What the low u50 gamers vs mid-low experience contrast probably shows is that the sheer volume of high draft picks the Dees have had access to over the years has allowed them to stockpile a comparatively large number of high quality 20-24 year olds. So lower on the experience scale, but less need to rely on the newer draftees week in week out. - Food for thought seems as how you’re interested. Didn’t think you’d mind the delay (had a busy weekend ), given curiosity has no deadline.
Aransan
Roar Rookie
I guess my comment was overly clever, a sequence of random heads and tails following a sequence of heads would appear to be a cold streak. Keep up the good work Ryan.
Doc Disnick
Roar Guru
What he should have said is a lukewarm streak.
RT
Roar Rookie
hfm, the article is all about where we might expect a team to finish this year based on a) whether they were better/ worse / about the same than their ladder position last year suggested (e.g. a lot of close losses suggests the team might do better; a lot of blow outs suggests they are as bad as we might think) b) how things are relative to last year (e.g. tougher double up opponents) Richmond have the same number of interstate games this year as last and one less MCG game. So 2019 relative to 2018 is not much difference and not significant to Ryan's analysis. If you don't think Richmond are as good as their record suggets due to all the MCG matches that's fine, but all things being equal, nothing will change in 2019. I stand to be corrected, but I don't recall any team have a massive change from 2018 to 2019 in terms of travel or away games at home.
CD
Guest
Great article but interested to know more about the reliability of the blowout stat - agree that a 10 goal thumping on a dry ground (say under a closed roof) is likely to indicate a more skilful and attacking team making the most of their chances. But doesn’t this tend to obscure strong wins albeit in conditions less favourable to a high scoring margin? To some degree a 5 goal win on a blustery day or in wet conditions might also be considered a blowout, just of a different type. Also game/coaching style and available personnel surely introduces a skew - there are some teams who will grind out good wins consistently without necessarily needing or wanting a game plan predicated on piling on the goals?
anon
Roar Pro
I think it was 2014. Geelong won something like 7/7 in close games. Got bundled out in straight sets. Missed the finals 2015. Pretenders.
Raimond
Roar Guru
The idea that interstate games are irrelevant to a discussion like this is bizarre. It’s a huge factor.
Rowdy
Roar Rookie
I believe the long term does not bear this. My bro, a Sainter, has been livid about this for years. Maybe this year is an evening up.