The Australian cricket team has had some pretty handy Test match players over the 143 years or so since they first knocked over the English in Melbourne in 1877.
At times those players have arrived in a sufficiently large cluster to form some handy teams as well, as evidenced by Australia’s world record of 16 consecutive Test wins, achieved twice.
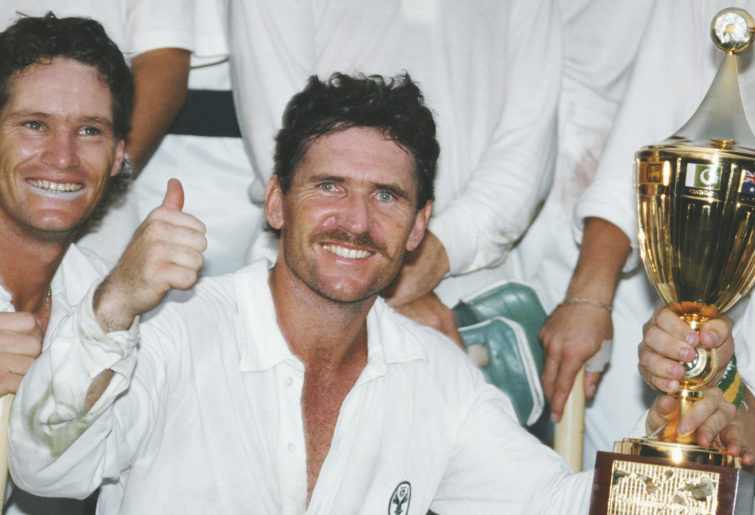
Adam Gilchrist famously won his first 15 Test matches in a row and performed fairly well in them too (992 runs at an average of 58.35 and a strike rate of 76.54).
Which got me thinking, who are our ‘winningest’ players. That led me to three criteria:
– Most total wins
– Best win/loss ratio – e.g. a ratio of three means between every Test loss a player would have expected to win three other matches (ignoring draws).
– Best performances in those wins.
I thought there’d be plenty of readily available lists to cover these statistics, but apparently not.
Nevertheless I have ploughed on and present a snapshot of some of our most successful Test cricketers. Today I will look at total wins and winning percentages, with individual performances in wins examined in a later article.
There have been 14 Australians who have won at least 50 career Test matches (refer table at the end of the article for details). It’s no surprise, given the greater number of matches played in the modern era and Australia’s dominance between 1995 and 2007, that most of these players come from or at least overlap with that era.
One notable exception is Allan Border. After taking charge of the Australian team after they hit absolute rock bottom in late 1984, AB bowed out just as his country was on the cusp of overtaking the West Indies as world number one.
Border won exactly 50 of his 156 Test matches. Despite the era he endured, Border’s win/loss ratio was actually just in the black, 1.09 to be exact. Border was a fighter during his entire career.

Australia celebrate winning the 1987 Cricket World Cup, just three years after one of their lowest points. (Photo by Allsport/Getty Images)
He averaged 51.4 in wins, which is good but not much more than his career average. In losses he managed only 33.4, in other words when Border failed so did the team. But in draws Border averaged 68.7 and scored 16 of his 27 centuries. He was a rock when the team needed to avoid a loss.
And his team drew a lot. Of his 156 Tests, 59 were draws compared to 50 wins and 46 losses (plus one memorable tie).
The only other Australians to win at least 50 Tests with a win/loss ratio of less than two are Ian Healy and Michael Clarke. Plus one player who has recently joined the 50 wins club, but more on him later.
Now contrast Border with the aforementioned Gilchrist. This turbo charged keeper batsman transformed an already world leading side into a virtually unbeatable juggernaut, finishing with 73 wins from only 96 matches and a win/loss ratio of 6.64.
To put that in perspective, Gilchrist was expected to lose one single Test match out of each seven he played.
This record is 35 per cent better than any other Australian in history. In fact, only five other players in the history of Test cricket have ever finished with a win/loss ratio of even four and none of these achieved a ratio of 5.
Those five players are Glenn McGrath (84 wins at 4.2), Justin Langer (70 at 4.12), Brett Lee (54 at 4.91) and the great West Indian openers Gordon Greenidge (57 wins at 4.09) and Desmond Haynes (60 at 4.0).
Why do the Australians of the 1990s to 2000s era have higher win/loss ratios than even the great West Indian side of the 1980s? Partly this is due to the two streaks of 16 wins in a row, but also because the instances of drawn Tests dropped dramatically after the mid 1980s, especially in Australia.
In the modern era Australia simply didn’t do draws. On the few occasions where they didn’t simply crush their hapless opponents, they tended to implode, going down in a blaze of glory. For example, Glenn McGrath was involved in only 20 draws from 128 Tests (15.6 per cent).
Desmond Haynes had 41 draws from 116 matches (35.3 per cent or three times as often). So while McGrath’s win/loss ratio of 4.2 is marginally higher than Haynes’ 4.0, McGrath also lost 20 Tests, which was 16 per cent of those he played, while Haynes only lost 15 times or 13 per cent. In summary the Australians may have been the better attacking side, but the West Indies were able to defend and were slightly harder to beat.
Ricky Ponting is only player in cricket history from any nation to notch up more than 100 Test wins – 108 to be exact from 168 matches. Ponting only lost 31 Tests in his entire career, but somehow managed to lose three Ashes series with that record.
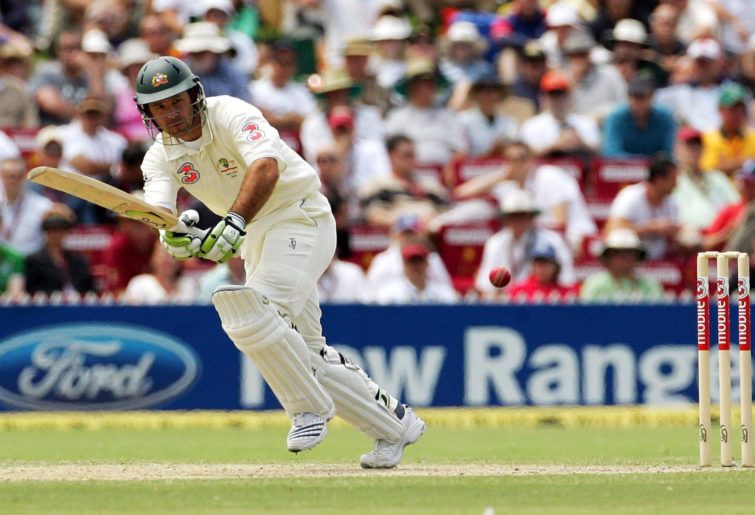
Ricky Ponting in 2006. (James Knowler/Getty Images)
There are some other interesting names on this list.
For those with 50 career Test wins, Brett Lee has the second highest win/loss ratio in world Test cricket history, at 4.91. Lee lost just 11 out of 76 career Tests. That surprised me, but I guess he was usually the third seamer behind the impressive McGrath/Gillespie pairing and lost only 4 of his first 37 Tests prior to the famous 2005 Ashes in England.
Steve Waugh won 86 from 168 Tests with a win/loss ratio of 2.39, which is not too shabby. Two periods from Waugh’s career have contrasting effects on his winning record.
Waugh only won four of his first 26 Tests prior to the famous 1989 Ashes victory and his record during that period was an underwhelming 1,099 runs at an average of 30.5 and 40 wickets at 39.3. In fact Waugh did not get to sing the team song until his 13th appearance.
Much later on, Waugh won 49 Tests from 57 matches as captain for a win/loss ratio of 4.56, which makes him one of Australia’s ‘winningest captains’ (Bradman won 15 and lost only three, while ‘The Big Ship’ Warwick Armstrong won 8 Tests and never lost). During that period as captain Waugh scored 3,714 runs at 52.3.
However, Mark Waugh actually had a marginally better career win/loss ratio than his older brother.
In other comparisons of win/loss ratios, current national coach Justin Langer had a better ratio than his long time opening partner Matthew Hayden, although Haydos did win one more Test than Langer over his career. Glenn McGrath also shades his superstar compatriot Shane Warne.
But to fair in each of those cases we are comparing great with great. They all won at least three Tests for each loss suffered.
Given players from earlier periods did not have the opportunity to play so much Test cricket (Bradman played only 52 matches across nearly 20 years), how do some of these past greats stack up?
I’ve added a table below showing selected players for comparison. The interesting ones include:
– The great opening bowling partnership of Ray Lindwall and Keith Miller, both with win loss ratios around the 3.5 mark, similar to Ricky Ponting and Shane Warne
– The underrated Neil Harvey, often forgotten now in best of sides, with 41 wins, more than Greg Chappell and at a win/loss ratio of 2.73 compared to Chappell’s 2.00. For comparison, Don Bradman’s win/loss ratio was 2.50.
– No player on the list, even David Boon who played through the 1980’s, has a win/loss ratio of less than 1.
How do our modern stars look? We hold the Ashes, but little else in the current era. There is one player who has reached the magical 50 wins mark and it’s not Steve smith or David Warner.
Nathan Lyon currently sites at 51 wins from 96 Tests, although his win/loss ratio of 1.76 is the worst after Border.
Here is a selection of other modern Australian cricketers:
| Player | Matches played | Won | Lost | Draws | Win/loss ratio |
|---|---|---|---|---|---|
| David Warner | 84 | 47 | 25 | 12 | 1.88 |
| Mitchell Johnson | 73 | 39 | 22 | 12 | 1.77 |
| Steve Smith | 73 | 39 | 25 | 9 | 1.56 |
| Mitchell Starc | 57 | 31 | 20 | 6 | 1.55 |
| Josh Hazlewood | 51 | 25 | 18 | 8 | 1.39 |
| Pat Cummins | 30 | 17 | 9 | 4 | 1.89 |
| Ryan Harris | 27 | 16 | 6 | 5 | 2.67 |
Ryan Harris, what a player!
Looking around the world, there is a select group of players who have won more than 50 career Tests but only West Indians Greenidge and Haynes, plus the mighty Viv Richards, did it with a win/loss ratios greater than 3.
The very strong South African sides of recent vintage including players such as Hashim Amla (64 wins), AB de Villiers (57), Jacques Kallis (82), Mark Boucher (74) and Graeme Smith (60) had ratios hovering around the two mark. The great Dale Steyn finished with 48 career wins.
The extremely long career of Sachin Tendulkar netted him 72 wins (10 less than Kallis and 26 less than Ricky Ponting) but at a win/loss ratio of only 1.29.
The great Sri Lankan trio of Muralitharan (54 wins), Sangakkara (58) and Jayawardene (53) all had win/loss ratios around 1.3.
For England, Alastair Cook netted 67 wins at 1.22. James Anderson has 53 wins at home but only 17 away for a total of 70 win at a win/loss ratio of 1.32. Stuart Broad is the king of wins for England – his 65 wins came at a win/loss ratio of 1.48. Joe Root currently has 43 wins at 1.22.
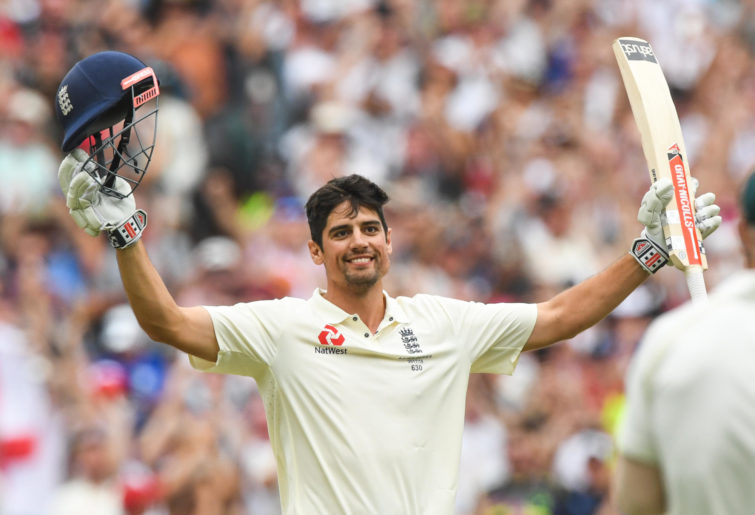
Alastair Cook. Winner. (Photo by Morgan Hancock/Action Plus via Getty Images)
And what of the very good modern Indian team. King Virat Kohli has 44 wins to date from 86 Tests, one less than his much less compatriot Cheteshwar Pujara who heads the list with 45 wins from only 77 Tests at a win/loss ratio of 2.5. A truly valuable Test player. Ishant Sharma has 44 wins and Ravi Ashwin has 42.
Our Kiwi cousins don’t win as much as they would like and no one has tasted victory more than Ross Taylor with 37 career wins, at a ratio just under 1 (i.e. he has lost slightly more than he has won). Trent Boult has had his share of success, with 31 wins coming at a very respectable rate of 1.4.
Elsewhere, the great Pakistan batsman Younis Khan participated in 46 wins and 45 losses from 118.
So this article shows us what we already know – during the 1990’s and 200’s Australia won a lot, an awful lot. We may never see their like again.
Next time we will look at players who shine when Australia wins and drag their teammates over the line.
Australian players involved in 50 or more Test wins (to 12 September 2020):
| Player | Matches played | Won | Lost | Draws | Win/loss ratio |
|---|---|---|---|---|---|
| Ricky Ponting | 168 | 108 | 31 | 29 | 3.48 |
| Shane Warne | 145 | 92 | 26 | 27 | 3.54 |
| Steve Waugh | 168 | 86 | 36 | 45 | 2.39 |
| Glenn McGrath | 124 | 84 | 20 | 20 | 4.2 |
| Adam Gilchrist | 96 | 73 | 11 | 12 | 6.64 |
| Mark Waugh | 128 | 72 | 27 | 29 | 2.67 |
| Matthew Hayden | 103 | 71 | 18 | 14 | 3.94 |
| Justin Langer | 105 | 70 | 17 | 18 | 4.12 |
| Michael Clarke | 114 | 63 | 32 | 19 | 1.97 |
| Ian Healy | 119 | 55 | 29 | 35 | 1.9 |
| Brett Lee | 76 | 54 | 11 | 11 | 4.91 |
| Mark Taylor | 104 | 52 | 20 | 32 | 2.6 |
| Nathan Lyon | 96* | 51 | 29 | 16 | 1.76 |
| Allan Border | 156 | 50 | 46 | 59 | 1.09 |
A selection of other great Australian players, for comparison
| Player | Matches played | Won | Lost | Draws | Win/loss ratio |
|---|---|---|---|---|---|
| Victor Trumper | 48 | 22 | 14 | 12 | 1.57 |
| Clem Hill | 49 | 25 | 16 | 8 | 1.56 |
| Warwick Armstrong | 50 | 28 | 12 | 10 | 2.33 |
| Clarrie Grimmett | 37 | 20 | 10 | 7 | 2 |
| Don Bradman | 52 | 30 | 12 | 10 | 2.5 |
| Ray Lindwall | 61 | 33 | 9 | 19 | 3.67 |
| Keith Miller | 55 | 31 | 9 | 15 | 3.44 |
| Neil Harvey * | 79 | 41 | 15 | 22 | 2.73 |
| Richie Benaud * | 63 | 24 | 13 | 25 | 1.85 |
| Greg Chappell | 87 | 38 | 19 | 30 | 2 |
| Dennis Lillee | 70 | 31 | 16 | 23 | 1.94 |
| Jeff Thomson | 51 | 21 | 18 | 12 | 1.17 |
| David Boon * | 106 | 41 | 25 | 40 | 1.64 |
| * 1 tie |
Rohan
Roar Rookie
Ryan Harris, what a player! :stoked:
Once Upon a Time on the Roar
Roar Guru
Steve Waugh would get an honourable mention from when he was dropped from the one day side. And the sookiest ever would be Shane Warne when he was left out of a solitary test, which Australia had to win, and did. More than 20 years later he still holds a completely perspectiveless grudge and SWaugh.
AREH
Roar Guru
And poor Watto hated being dismissed in general - I have never known someone to appear so genuinely mystified at getting out! Haha...think there is even a snippet of Griegy's commentary once which says it
ChrisB
Roar Rookie
It would be harder in a club based team sport, given the frequency of competition, but for an occasional international competition, perhaps not as hard to match. I;d imagine some of the Dutch Women's Hockey team or the All Blacks might be within striking distance of that average
All day Roseville all day
Roar Guru
Matthew Hayden hated spectators moving beside the sightscreen, and the glass in dressing room doors after being dismissed. Damien Martyn hated spectators annoying him when he fielded on the boundary. Shane Watson hated being given out lbw, unless there were DRS challenges left. But all quite reasonable whinges ?
Nick
Roar Guru
Ricky Ponting would be close to the top. An incredibly sore loser.
Nick
Roar Guru
Lol - you could argue that Voges was the most influential person in the team then and that they needed him more than they realised.
Dwanye
Roar Rookie
Love or hate the agro/bullying or the Aust team during the ‘winning’ period, it was part of S.Waugh’s mindset and captaining to ‘cutout’ those draws and dead rubbers. The games that the big W.I. Team could be seen to switch off, Aust stood on the opposition, twisted the foot into the ground.
matth
Roar Guru
Yes good call, forgot about the All Blacks. Probably due to years of trauma at their hands. Perfect comparison, thanks.
Targa
Roar Rookie
Interesting article. In terms of rugby Tawera Kerr-Barlow (not a regular starter for the ABs due to Aaron Smith) played won 26 of his 27 tests although he came off the bench in almost all of those. Richie the GOAT McCaw played 148 tests for 131 wins, 15 losses and 2 draws (89%). Absolute legend.
matth
Roar Guru
You would probably only see something like that Gilchrist ratio in a niche individual sport. For example Heather McKay the squash champion who was undefeated between 1962 and 1977. Or Walter Lindrum in billiards. Even Roger Federer in his super dominant period pre Nadal. It’s much harder in a team game I would think, although I’m sure there would be examples. For example, if you looked at the Australian Rugby League team in the 1980’s to 200’s they would have had a similar ratio. But the wider the competition the hard it is. Liverpool last season? But over a career in a team sport is ridiculous.
Sgt Pepperoni
Roar Rookie
Beat me to it Harvey. I was surprised to see the picture of Mitch Johnson and then I re-read it Who would be our whingiest players? M. Clarke?
Paul
Roar Guru
You've put together some terrific articles this year Matt and this is one of the best of them, IMO. I wouldn't know where to start looking for the needed to decide who was top of the pile, across on hundred odd years of Test cricket. It's easy to understand why some players/teams might have become arrogant when they were winning so regularly. That's the sort of thing that both the great Windies sides of the 80's & 90's and the Aussies who feature so much in your tables have in common. As an aside, I wonder how Gilchrist numbers stack up against other Aussie sports? I was looking at Cam Smith, for example and I think he wins about 2.69 games before a loss. A wonderful record for rugby league but not even close to Gilly's numbers.
matth
Roar Guru
All good points and possible factors. I will say however, that while draws in general headed downwards in the 1990’s and following, it happened later and in a less dramatic fashion for other teams than for Australia. South Africa and India and Pakistan still did draws in that era. The implication might be that I’ve time they copied the Australian method. Or alternatively faster scoring rates leading to more time to win or loss matches has naturally followed over time.
matth
Roar Guru
That would be a fun article, but I’ll leave it someone else I think to go down that rabbit hole.
matth
Roar Guru
The second article in this series will look at just that, who has performed best in wins.
matth
Roar Guru
You’d almost have to look at the circumstances of the draw. Allan Border had a high draws average and the perception would be of back to the wall gritty innings. The truth may well be otherwise, but you’d have to split the draws along arbitrary lines. There is a stats guy on Cricinfo who has tried to quantify this sort of thing and the statistician Charles Davis came up with a “Pressure average”, but how it goes all depends on what is defined as pressure. For example, Bradman may have come in during many pressure situations, but if you look at the matches in retrospect, by the time he was finished the ressure was generally well and truly off.
Harvey Wilson
Roar Rookie
You can link it to being the most influential too. Someone like Steve Smith averages 81 in wins and 31 in losses. You could say he influences both results. But then, Shane Watson averages 34 in wins and 30 in losses. You could say that he might as well not have been there at all.
Harvey Wilson
Roar Rookie
When i glanced at the title, i read it as Australia's Whingiest Test Cricketers. LOL. That would be an interesting article.
DaveJ
Roar Rookie
I think your reason why Australia didn’t do draws in the modern era (I guess meaning from late 90s) is partly right. But it’s also probably due to the fact that they only started making up time lost from rain and bad light from around that time, if memory serves, whereas there were more draws due to time lost in previous years. Another reason the great Windies team of the 80s had more draws was the lack of a good spinner to finish teams off, compared to the Australian teams with Warne or MacGill. We could perhaps add that after the 80s there have been more easybeat Test teams in the mix, such as Zimbabwe, Bangladesh and occasionally Sri Lanka, and West Indies from the early 2000s. There were equivalents in early periods – Windies and India before WWII, NZ up to the 50s at least- but Australia didn’t play too many games against them. I’d suggest that the 90s was the decade when competition was stiffest – with Windies, Aus, South Africa, Pakistan all strong; India, England and Sri Lanka competitive (though not a great decade for England), while NZ could cause trouble