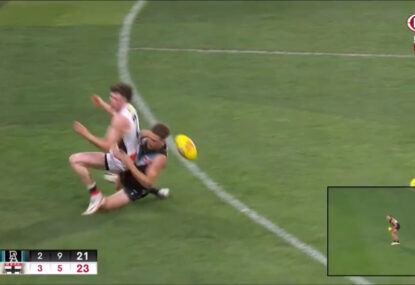
Footy Fix: Ross Lyon is the AFL's most boring coach once again - and it's suffocating the Saints' season
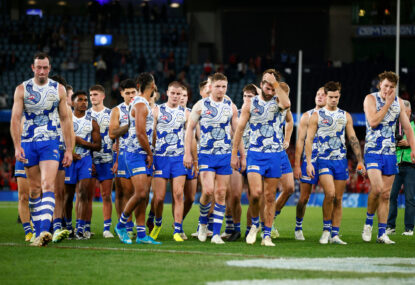
On the scoreboard, it looks like a creditable St Kilda performance. A loss to a Port Adelaide outfit many see as a premiership contender…

With the 2015 AFL season just moments away, here’s my look at each team and their chances this year.
I will again attempt to predict which teams will improve and which ones will decline – with the help of some statistics.
Prior to the start of the 2014 season, I showed which teams had the hardest and softest draw for the year. I’ll be doing the same for this season by using the same simple formula.
The strength of draw formula is the average amount of wins the opposition team had for the season. For example, in 2014 North Melbourne’s opponents averaged 10.4 wins for the season, which was the softest draw in the competition, while Brisbane had the hardest with their opponents averaging a whopping 11.8 wins. When you consider that 11 wins is the league average, a strength of draw rating of 11.8 is huge.
The good news for Lions fans is it will get a little easier in 2015. But more on that later.
Using last season’s win totals, we can estimate how tough each team’s draw will be in 2015. Again using North Melbourne as an example, they won 14 games last season, so whenever a club plays the Kangaroos in 2015 were estimating they are playing a 14-win team.
You might argue the accuracy of this, as team-win totals change from one season to another but if you check the estimated strength of draw for each team in my 2014 article, you’ll notice it was very similar to how it actually played out.
I also like to factor in how ‘lucky’ teams were in close games- decided by two goals or less – to show how it affected their win total. Again people will argue that winning the close games is a sign of a good side, and their point is backed up by Geelong and Hawthorn finishing 2014 with fantastic records in two-goal games, however this was an anomaly.
The two seasons prior to 2014 – in games decided by two goals or less – both clubs had a combined record of 12 wins and 11 losses. And if we include the records of Fremantle and Sydney in such games over the same time period, we get a record of 19 wins and 17 losses. A surprisingly mediocre return for the four best teams in recent years.
So with the vagaries of the draw and the luck involved in winning close games noted, let’s have a look at how each team will fare in 2015.
In order of 2014 ladder position.
Sydney
2014 record – 17-5
2014 Strength of Draw – 11
2014 record in 2 goal games – 2-2
2015 estimated Strength of Draw – 11.1
Not much to see here, similar strength of draw to last season while producing an even two win-two loss record in close games. Fairly safe to assume Sydney will again finish around the 17-win mark and push for the minor premiership.
Hawthorn
2014 record – 17-5
2014 Strength of Draw – 11.4
2014 record in 2 goal games – 4-0
2015 estimated Strength of Draw – 11.3
Rode their luck with +4 win aggregate in two goal games but they had to deal with a horrific injury toll, while also missing Alastair Clarkson for a large chunk of the season. Therefore, 17 wins again feels appropriate.
Geelong
2014 record – 17-5
2014 Strength of Draw – 11
2014 record in 2 goal games – 7-0
2015 estimated Strength of Draw – 11.4
Look at that record in two-goal games – that type of luck is not sustainable. If that figure were to even out to a 4-3 record, Geelong would have only finished with 14 wins for the season. Couple that with a slightly tougher schedule and I don’t see Geelong winning more than 15 games. Mitch Clark will help but how many wins is he worth?
Fremantle
2014 record – 16-6
2014 Strength of Draw – 11.3
2014 record in 2 goal games – 3-1
2015 estimated Strength of Draw – 11.2
Even with the Ryan Crowley situation, Ross Lyon will keep this team chugging along. As with all clubs, keeping players on the park will be the key.
Port Adelaide
2014 record – 14-8
2014 Strength of Draw – 10.9
2014 record in 2 goal games – 2-5
2015 estimated Strength of Draw – 11.4
Port have a tougher draw this year but they are a young side still improving. A little more luck in close games should see them pushing for around 16-17 wins.
North Melbourne
2014 record – 14-8
2014 Strength of Draw – 10.4
2014 record in 2 goal games – 2-1
2015 estimated Strength of Draw – 11.3
With success comes a tougher draw. That’s your reward in the AFL for becoming a contender. The league does a great job of matching the stronger clubs against each other and vice versa for the weaker sides.
Unfortunately for the Kangaroos, they aren’t exempt from that policy, going from the easiest draw in 2014 to one of the toughest in 2015.
Hard to gauge the Roos, they lost a key young player while adding two decent senior players, plus how much more can they squeeze out of Brent Harvey? With a much harder draw this season they might find it difficult improving on last year’s win total of 14.
Essendon
2014 record – 12-9-1
2014 Strength of Draw – 10.9
2014 record in 2 goal games – 6-3
2015 estimated Strength of Draw -11.1
Essendon are also hard to gauge. Similar draw to last year, maybe a touch lucky in close games, plus we need to factor in an interrupted pre-season due to the drug saga. But with the pressure and the burden being lifted off their shoulders, will it bring about a lift in performance?
Richmond
2014 record – 12-10
2014 Strength of Draw – 10.6
2014 record in 2 goal games – 3-3
2015 estimated Strength of Draw – 11.2
Very bad start to last season but with the help of an easy draw the Tigers were able to sneak into the top eight. They’ll find that more difficult this year due to a tougher draw.
West Coast
2014 record – 11-11
2014 Strength of Draw – 10.5
2014 record in 2 goal games – 2-4
2015 estimated Strength of Draw – 10.7
Didn’t make the most of a very soft schedule last season, really should have made the finals with that strength of draw. The Eagles will have another chance this year but injuries to Eric McKenzie and Jack Darling make the task a little harder. They’ll be hoping another season under Adam Simpson can push them to 12 wins.
Adelaide
2014 record – 11-11
2014 Strength of Draw – 10.7
2014 record in 2 goal games – 1-5
2015 estimated Strength of Draw – 10.9
Horrendous record in two-goal games last season, they’ll be certainly looking to improve upon that. Depending on how they take to the new head coach, Adelaide should be able to improve on the 11 wins from 2014.
Collingwood
2014 record – 11-11
2014 Strength of Draw – 11.2
2014 record in 2 goal games – 3-3
2015 estimated Strength of Draw – 10.9
It is a make or break year for Nathan Buckley, not sure he’s gotten the most out of this side. Based on the above information it’s hard to envision the team improving and that’s without factoring in the loss of Dayne Beams and the clenbuterol dilemma.
Levi Greenwood’s a nice addition and the Pies will be hoping Dane Swan starts doing Dane Swan things again. They have the talent but can Buckley extract it out of them?
Gold Coast
2014 record – 10-12
2014 Strength of Draw – 10.6
2014 record in 2 goal games – 2-2
2015 estimated Strength of Draw – 10.8
Barring another Gary Ablett injury, the Suns are heading for their first finals appearance. They’ll win at least 12 games.
Carlton
2014 record – 7-14-1
2014 Strength of Draw – 11.3
2014 record in 2 goal games – 2-6
2015 estimated Strength of Draw – 11.1
Carlton were so bad last year, that even if we flipped their close game record into six wins and two losses they still would have missed the finals.
They’ll probably improve on the seven wins from 2014 but they won’t be playing in September.
Western Bulldogs
2014 record – 7-15
2014 Strength of Draw – 11.3
2014 record in 2 goal games – 2-5
2015 estimated Strength of Draw – 10.5
Based on the above numbers, you’d expect the Bulldogs to improve. Much easier draw in 2015 to go along with a somewhat unlucky close game record in 2014. If Brendon McCartney were still in charge I’d say they’re a real chance to win 10 games, but under a new coach that’s hard to judge.
Brisbane
2014 record – 7-15
2014 Strength of Draw – 11.8
2014 record in 2 goal games – 4-2
2015 estimated Strength of Draw – 10.9
Brisbane are everybody’s pick to make the biggest leap in 2015, mostly due to the additions of Dayne Beams and Allen Christensen. Also look at the difference between the strength of draw of 2014 compared to 2015. That alone could add two or three wins on the season.
If the Lions can avoid serious injuries and unlucky close losses, they could push for as many as 12 wins.
Greater Western Sydney
2014 record – 6-16
2014 Strength of Draw – 11
2014 record in 2 goal games – 2-4
2015 estimated Strength of Draw – 10.6
Greater Western Sydney are also on the rise. Ryan Griffin and Joel Patfull are super additions and they have a softer schedule this time around. There is no reason to think they can’t get to 10 wins.
Melbourne
2014 record – 4-18
2014 Strength of Draw – 10.9
2014 record in 2 goal games – 2-3
2015 estimated Strength of Draw – 10.8
Don’t see how the Dees can gain any ground on the teams above them on the ladder. Although they’ve drafted well the past two seasons, in years previous it has been diabolical. There are plenty more years of rebuilding required here.
St. Kilda
2014 record – 4-18
2014 Strength of Draw – 11.1
2014 record in 2 goal games – 1-1
2015 estimated Strength of Draw – 10.7
Pretty much everything I wrote about the Demons, also applies to the Saints. Although with the softer draw, they should be able to leapfrog the Dees out of last place.
Who’s in your ultimate team? Pick the best team and compete with other fans for daily prizes on Draftstars. For the best odds on the game try out Aussie bookmaker PlayUp. Think. Is this a bet you really want to place? Set a deposit limit.
On the scoreboard, it looks like a creditable St Kilda performance. A loss to a Port Adelaide outfit many see as a premiership contender…

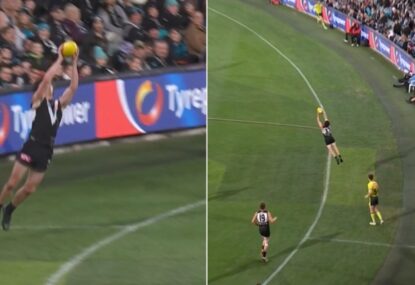
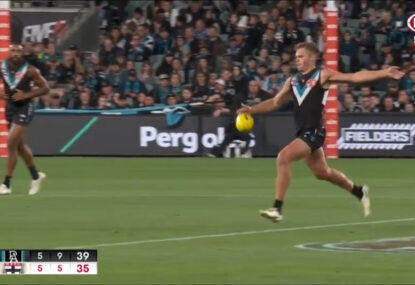
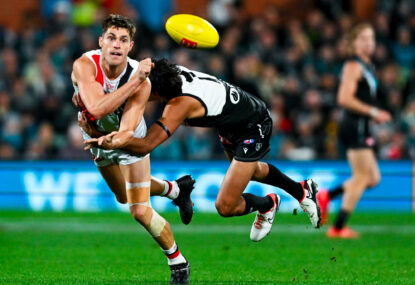
Was this Darcy Byrne-Jones mark correctly paid or not?
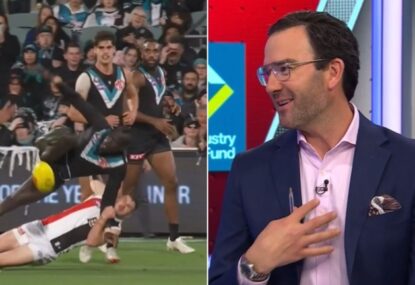
Did Darcy Wilson milk this free? Luke Hodge certainly thought so!
Eddie McGuire's latest bold idea has dropped - for North Melbourne to take over the outskirts of Melbourne and use it to rejuvenate the…