


- Video
-
Club Roar
Captured a great grassroots sporting moment? We want to see it!Content Collections
The Roar Community
- Join
- Login
The Wallabies appear to be going backwards in 2013, having been well and truly outplayed by their opposition in their last four Tests.
After six matches this season I’ve looked at the statistical differences between the team in the last three matches of Robbie Deans’ reign and the first three under Ewen McKenzie.
David Lord almost beat me to the punch with his similar topic yesterday but my analysis looks at things from some different angles.
I track 237 different statistics for matches (201 for the team and 36 for players). Of those, 131 are quantitative (measure quantity) and 106 are qualitative (measure effectiveness). I then prepare additional qualitative statistics for particular areas dependent on what I see in a match or what I’m writing about.
I’ve looked at all the measures I track and selected those that I feel are noteworthy including the statistics I track where there is some meaningful difference as shown in the chart below.
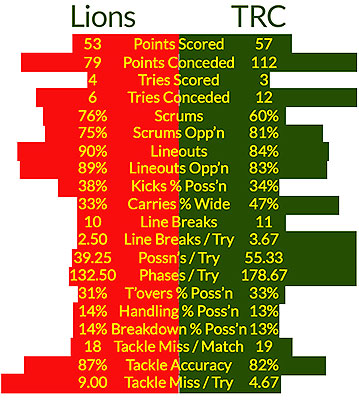
The first thing that stood out is how similar most of the statistics are between the two periods and the reason I didn’t include a larger number of measures in the chart is that there is so little difference between most of them – only 12 of the 237 measures I track show any significant difference.
Let’s look at the areas I’ve included statistics for.
Points scored and conceded
Obviously the big difference here is in the points and tries conceded and I’ll go into a little more detail on that area when I consider defence.
Set piece
The scrum numbers confirm how the Wallabies have been caught out by the new scrum laws. In the Lions series with essentially the same players and the same scrum coach the Wallabies actually won a slightly higher percentage of scrums than the Lions.
The Wallabies winning percentage on their own feed has dropped significantly in The Rugby Championship while the percentage won by the opposition on their feed has increased.
The only other difference in the six matches in the scrum is the absence of Benn Robinson in the last three matches. I still hold the view that he should at least be on the bench for the current Wallaby team but the loosehead side of the scrum isn’t where the Wallabies real problems are so even if he were in the team, I doubt the results would have been much better.
The scrum continues to be a major issue with the fact that the Wallabies are getting belted not only disrupting their ability to build momentum by retaining their ball to attack with but also giving their opponents a mental advantage in other contact areas.
The Wallabies percentage of lineouts won on their throw is down slightly which I think is a result of playing the top two teams in the world who both have very good lineouts. The Wallabies have slightly improved their results on the opposition throw so I don’t see any significant issues with the lineout.
Kicking
Interestingly the percentage of possessions that ended in a kick is very similar over the six matches despite the impression that the Wallabies are trying to run the ball much more in the last three matches – 38% against the Lions compared to 34% in the last three matches.
The percentage of possessions ending in a kick for their opposition was 49% in the Lions series and 47% so far in The Rugby Championship.
The Wallabies kicking numbers in 2013 are well below their opposition which suggests they probably need to change the balance in their game to kick a little more.
Attacking efficiency
There is a significant difference in the percentage of carries where the player is running wide of the ruck – up from 33% to 47%. This has been the most obvious change in the Wallabies game plan as they try to play with more width.
They haven’t seen any payback from this strategy to date with only one additional line break over that in the Lions series and one less try. While they have created one more line break than during the Lions series their opposition in the last three matches has also made significantly more line breaks than the Lions did – up from 10 by the Lions to 19 so far in The Rugby Championship.
The Wallabies defensive woes have certainly not helped in this area.
The efficiency of the Wallabies attack has also decreased. Whereas they averaged 2.50 line breaks for each try scored in the Lions series that measure has increased to 3.67.
The average number of possessions and phases the Wallabies have the ball before they are able to score a try have both increased significantly.
Compare the 55.33 possessions the Wallabies are now averaging before they score a try to the 15.42 for their opposition in The Rugby Championship.
Similarly the Wallabies had the ball an average of 178.67 phases before they scored a try in the last three matches compared to their opposition with an average 42.75.
Turnovers
You may expect one of the reasons the Wallabies are not being efficient in their attack is the number of turnovers of possession with handling errors and ball lost at the breakdown being the two biggest factors.
The Wallabies have turned over 33% of their possessions in the last three matches but that is only slightly up on the 31% against the Lions.
Incredibly the percentage of possession turned over from handling errors has actually fallen slightly, from 14% down to 13% with the same numbers also applying to possession turned over at the breakdown.
The area where the Wallabies have turned over more possession than in the Lions series is from set pieces.
Defence
Clearly the number of tries and points conceded confirms what we all know – the Wallabies defence has not been good enough.
The average number of tackles missed per match is only slightly higher in the last three matches at 19 than it was during the Lions series at 18.
Interestingly the average number of tackles missed by the Wallabies opposition has been higher than the Wallabies with the Lions missing an average of 20 tackles per match and an average of 21 in the last three matches.
Of course the number of tackles missed is not the relevant measure to look at as the more tackles a team has to make the more tackles they will likely miss.
The more relevant measure is the tackle accuracy (or completion) percentage. It is very rare to see any team in international rugby exceed 90% in this measure – the All Blacks are averaging 87% tackle accuracy in The Rugby Championship so far.
While the Wallabies tackle accuracy has dropped from 87% to 82% in the last three matches it is not that far away from the 87% for the Lions and 86% for the opposition in the last three matches.
So how can the Wallabies miss less tackles than their opposition and have a tackle accuracy not far below their opposition and yet still have conceded so many tries and points in their last three matches?
One of the answers is the efficiency of the opposition in attack as discussed earlier. Both the All Blacks and Springboks pounced on any opportunity the Wallabies presented them with – they didn’t keep missing opportunities in attack like the Wallabies did.
I suspect two other reasons that the number of missed tackles by the Wallabies doesn’t reflect in their ability to stop the opposition scoring tries.
The first is that they are not scrambling in defence as well as they have in the last year or so when Deans was in charge.
The second is that the Wallabies defensive structure has been really poor in the last three matches allowing the All Blacks and Springboks to achieve significant overlaps on both sides of the field from which they have scored tries.
With clear space for the player on the end of the overlap the Wallabies haven’t had a player available to attempt a tackle or to miss that attempt. As a result no missed tackle has been recorded on many of those tries.
As I’ve shown you in recent analysis videos the Wallabies have got to fix their defensive structures and work harder to match numbers with the opposition.