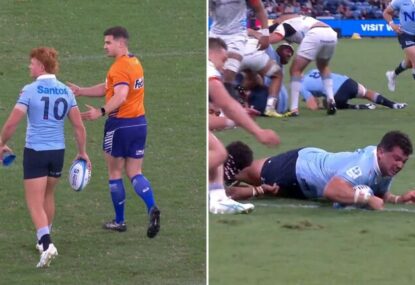
Waratahs capitalise on refereeing confusion to upgrade a penalty goal into a converted try
Tane Edmed was lining up a shot at goal when he was informed that the officials got the mark wrong. The Waratahs instead changed…
Opinion

Like any deprived fan I have found myself filling the live sports gap with voracious consumption of trips down memory lane and whatever content I can. Beyond the political, it has been pretty slim pickings to date. So I thought I would have a bit of fun investigating a few of the sport’s big questions.
The Rikki Bobbi Approach – “If you ain’t first – you’re last!”
New Zealand – 1987, 2011, 2015
Australia – 1991, 1999
South Africa – 1995, 2007, 2019
England – 2003
The gleeful argument for most southern nation supporters; 8-1 to the south – in your face northern hemisphere!
Then, like seagulls over a chip, we can squabble on the best of the south.
Based on wins as a percentage of appearances.
A bit harsh I feel on the teams who, despite blood sweat and tears, have just lost out to the errant bounce of the ball, the wispy edge of a whitewashed blade of grass or basic human error in the heat of battle.
After all – it’s the pageantry of all teams that adds to the story and not just the one that arrives at the summit. So, I decided to look a bit deeper at the consistency of performance across all events, to identify trend – and hopefully a few surprises.
Teams at the World Cup would be scored by nature of their final campaign placing. So, if team A won the event they would get one point, second two points, and so on. Quarter-finalists would get an equal eighth and if the team didn’t make it out of pool play then equal 16th – unless they placed last, in which case they would get 20 points. The reason for this would be to determine trends for increases in competitiveness at the bottom of the curve.
There is a certain symmetry to an event that has spanned 36 years, nine iterations and the transition from amateur to professional in equal tranches. To identify trends through the game’s evolution I have also looked at the following eras.
So, with that all out of the way, let’s get on with some COVID Excel pivot fun and games!
Ah yes, the golden coated, rose-tinted, non-hipster-mustached years when the game seemed better in all facets due to a combination of proper jerseys, fatigue, non-tackling backs, rucking/mountaineering and the dulcet brogue of Bill McClaren. You could practically taste the Dubbin and mud through the TV!
Winners: New Zealand (1987), Australia (1991), South Africa (1995)
| Country | Total Score | Appearances | Aggregate | Avg Place |
|---|---|---|---|---|
| South Africa | 1 | 1 | 1.0 | Winner |
| New Zealand | 6 | 3 | 2.0 | 3rd |
| Australia | 13 | 3 | 4.3 | Qtrs |
| France | 13 | 3 | 4.3 | Qtrs |
| England | 14 | 3 | 4.7 | Qtrs |
| Scotland | 20 | 3 | 6.7 | Qtrs |
| Ireland | 24 | 3 | 8.0 | Qtrs |
| Samoa | 16 | 2 | 8.0 | Qtrs |
| Wales | 35 | 3 | 11.7 | Pool |
| Canada | 40 | 3 | 13.3 | Pool |
| Fiji | 28 | 2 | 14.0 | Pool |
| Italy | 48 | 3 | 16.0 | Pool |
| Romania | 52 | 3 | 17.3 | Pool |
| Tonga | 36 | 2 | 18.0 | Pool |
| United States | 36 | 2 | 18.0 | Pool |
| Japan | 56 | 3 | 18.7 | Pool |
| Argentina | 60 | 3 | 20.0 | Last |
| Ivory Coast | 20 | 1 | 20.0 | Last |
| Zimbabwe | 40 | 2 | 20.0 | Last |
Having only appeared in a single World Cup in the era and also winning it – the statistical anomaly and winner is clearly South Africa. A pivotal World Cup that has subsequently brought rugby to Hollywood’s attention – interestingly involving South Africa at different sides of the result.
With a World Cup win apiece, the top three triumvirate is rounded out by the ever consistent New Zealand (first, third and second) and Australia (fourth, first, quarter-finals).
As the north’s best performer, France (second, quarter-finals, third) narrowly misses out on usurping the Wallabies for third, with England trailing just behind.
The mere 0.4 between the three of them shows a high level of competitiveness.
The middle of the pack is rounded out by Scotland, Ireland and surprise packet at the time – Samoa.
What is surreal is how bad modern powerhouses Wales and Argentina were. Wales went from a tournament high of third in 1987 to not making it out of their pool, while the Pumas literally finished last in their pool at each tournament.
This is also the last time we will see more than six nations averaging a quarter-final appearance or higher.
Looking beyond the five nations and the then-yet to be established tri-nations. A combined view of all tiers shows an uninspiring and close average between hemispheres.
| All | Total Score | Appearances | Aggregate | Avg Place |
| North | 358 | 30 | 11.9 | Pool |
| South | 200 | 18 | 11.1 | Pool |
Looking at the Tier 1 nations (includes Argentina and Italy as I couldn’t find reference to when they ‘ascended’), a small gap opens at the top with the southern nations, on average, reaching the quarter-finals, while the northern hemisphere sit in the pool stages.
Remove Argentina and Italy from this equation and the crack becomes a grand canyon of 7.1 to 2.9! In layman’s that’s, third vs the quarter-finals!
| Tier 1 | Total Score | Appearances | Aggregate | Avg Place |
| North | 154 | 18 | 8.6 | Pool |
| South | 80 | 10 | 8.0 | Qtrs |
A cursory glance at the Tier 2 comparison shows again, a very close aggregate with the Southerners swinging it depending which way you throw the Ivory Coast.
| Tier 2 | Total Score | Appearances | Aggregate | Avg Place |
| North | 204 | 12 | 17.0 | Pool |
| South | 120 | 8 | 15.0 | Pool |
So there you have it for the amateur era!
Best performing nation: the Nelson Mandela-inspired, Boeing fly over, biltong inhaling, injury-time drop kickers, South Africa (yes a very limited sample but I don’t make the rules…. ok I did, so that’s that)
Hemisphere of Champions: southern hemisphere across all tiers.
In the next installment, I will take a look at how teams coped with the move to early professionalism, movers and shakers and whether frozen potato vodka is really bad for you.
Join The Roar rugby editor Christy Doran, former Wallaby Matt Toomua and a cast of regular and special guests as they look at the biggest issues in the game on The Roar Rugby Podcast. If you’re looking for great odds on the next game check out Aussie bookmaker PlayUp. Chances are you’re about to lose. Set a deposit limit.
Tane Edmed was lining up a shot at goal when he was informed that the officials got the mark wrong. The Waratahs instead changed…
Samipeni Finau was able to continue without even a penalty, after the TMO deemed it a legal tackle much to the Tahs' fans disgust.

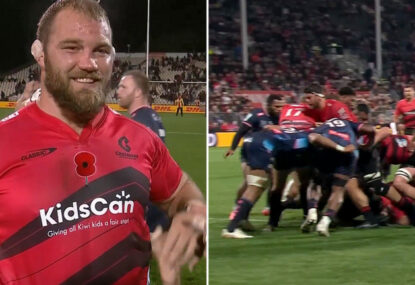
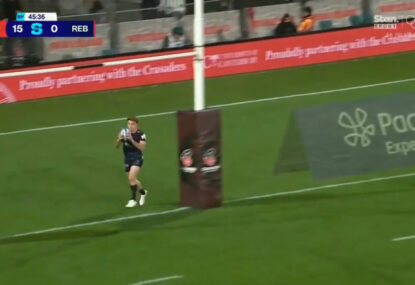
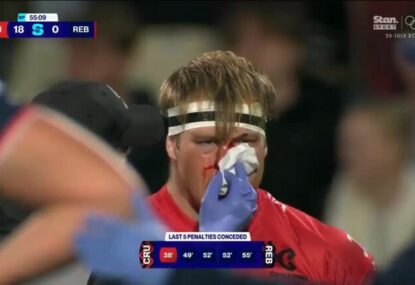
Written off ahead of the weekend in several quarters, the Crusaders have responded with full vengeance after smashing the fourth-placed Rebels 39-0 in an…

The big prop has only scored three tries in his career with the last coming in 2010.
The kick failed to pass the 22-metre line.
In the Canterbury region, it's not claret but pinot noir.