Over the weekend I had a piece on The Roar which raised the idea that there was such as thing as a ‘red zone’ in cricket.
The numbers put forward were pretty basic, high level and didn’t say a lot that was particularly meaningful – they were just percentages.
There wasn’t a lot of causation there although, as I said towards the end of the article and in the comments, the results were fairly intuitive.
I was really pleased to see there seems to be a bit of an appetite for more analytical work on Australian sports. So without further delay, here is a piece examining the idea of ‘pressure’ in cricket, and what it means for the likelihood of jagging a wicket in Test matches.
Throughout the ten Tests that made up the ‘Super Ashes’ of 2013-14, which is the period that I’ve got the data for, there were 3,376 overs bowled. Australia delivered 1,709 of these, while England made up the difference.
Over the course of the 10 Tests, there were 320 overs where one or two wickets fell. To work out the role building pressure plays in creating wickets, we first need to establish the rate at which we expect a wicket to fall. In these Tests, I’ve chosen to use a three over benchmark.
This showed that if a side bowls three overs, we can expect a wicket to fall around 10 per cent of the time in over bowled immediately after it (9.7 per cent to be precise).
So without even trying, necessarily – that’s not true, the bowling side still needs to, you know, bowl – a bowling side can expect to take a wicket after bowling three overs of anything roughly every 54 balls.
In any event, this gives us a method of testing how this ‘expected wicket rate’ (EWR) changes as circumstances within a given three over period change.
First, and perhaps most obviously, lets check out the role dot balls play in building pressure.
(A quick note: the +/- figures are a per centage difference between the per centages, not a simple add or subtract. This is because we want to see the impact of the change in probability. If that sentence hasn’t turned you off reading the rest of the piece, let’s get stuck in.)
Dot balls
A dot ball is seen as the perfect outcome – besides a wicket – for bowlers. The importance of building pressure through the accumulation of dot balls is the classic cricketing old wives’ solution for building pressure.
Prior to running the numbers, I must admit I thought if a batsman isn’t doing anything other than marking time, surely he’s bound to get out sooner than he would otherwise. The data, says otherwise:
| Test |
Occurrence |
Rate |
+/- |
| Three Overs Bowled w/ 50%+ dot balls |
3,063
|
9.37%
|
-3.5 %
|
| Three Overs Bowled w/ 60%+ dot balls |
2,864
|
9.50%
|
-2.2 %
|
| Three Overs Bowled w/ 70%+ dot balls |
2,184
|
8.76%
|
-9.8 %
|
| Three Overs Bowled w/ 80%+ dot balls |
1,020
|
9.31%
|
-4.1 %
|
| Three Overs Bowled w/ 90%+ dot balls |
178
|
7.30%
|
-24.8 %
|
In essence, bowling this many dot balls either slightly reduces the bowling side’s chance of taking a wicket, or, in the case of where 90% dot balls are bowled, the EWR falls dramatically.
In the latter’s case, it’s probably a due to a lack of occurrences more than anything – something we number crunchers call a ‘small sample size’.
But how do we reconcile the rest? One potential explanation is that through periods of the game, the batting side actually wants to accumulate dot balls.
Either eating some overs for strategic reasons, or playing for a draw in the fourth innings. The fact that the per centage of dot balls bowled has essentially no effect on the EWR regardless of the number of dots lends itself to this theory.
Scoring shots
Let’s take it to another level. If pressure isn’t necessarily brought about by dot balls – because the batting side might be deliberately playing them – how about by reducing the number of scoring shots?
Pressure in this respect would seem to mean batsmen are at least trying to be positive in their play, but are unable to get away – either by turning over the strike or crunching a boundary or two.
Here’s the role of scoring shots (which is boundaries + other shots):
| Test |
Occurrence |
Rate |
+/- |
| Three Overs Bowled w/ 12 shots or less |
3,277
|
9.67%
|
-0.4 %
|
| Three Overs Bowled w/ 10 shots or less |
3,235
|
9.61%
|
-1.0 %
|
| Three Overs Bowled w/ 8 shots or less |
3,084
|
9.37%
|
-3.5 %
|
| Three Overs Bowled w/ 6 shots or less |
2,675
|
9.23%
|
-4.9 %
|
| Three Overs Bowled w/ 4 shots or less |
1,796
|
8.85%
|
-8.8 %
|
| Three Overs Bowled w/ 2 shots or less |
655
|
10.23%
|
+5.4%
|
Success! Restricting a team to two or fewer scoring shots over a three over stretch lifts the EWR by 5.4 per cent.
Outside of this, the results largely mirror what happened when we tested dot balls – likely reflecting periods of the game where a side is playing defensively.
But back to the positive results. The implications of this are quite significant. If a bowling side is able to develop and execute attack plans against a batting side – plans which result in not just dot balls but in batsmen being unable to play the way they’d like – it can create a situation where the chance of getting a wicket increases by over five per cent.
Five per cent may not seem like much, but when a side only needs to take 10 wickets to win a match, that five per cent is a huge potential advantage.
Based on some basic modelling, this five per cent advantage can lead to a bowling side getting the batting side five wickets down seven overs earlier than otherwise, and capture 10 wickets 10 overs sooner.
There are a couple of other interesting points to be made here, too:
– In over 90 per cent of three over periods, the bowling side had eight scoring shots or less – that is, they faced either dot balls, batted out an extra, or lost a wicket.
– In over half (half!) of three over periods, the bowling side successfully scored runs off the bat less than four times.
This more or less puts to bed the theory about dot balls building pressure from my perspective, at least during this Super Ashes series.
Maybe if the theory is applied to a richer data set the results will be different.
Scoreboard pressure
Batsmen are thought to be the ‘smart breed’ of cricketers. The captain of any side, at least in Australia, is expected to be a batsman. And in fact, as the summer’s fourth ODI dilemma demonstrated, even if the opportunity presents itself, cricket just can’t seem to accept that anyone but a batsman can be captain.
What if that’s not the case, though?
While we’ve already seen that dot balls have practically no bearing on building pressure, and that restricting the number of scoring shots is only useful in some circumstances, do the numbers on the scoreboard play a greater role?
I have a feeling this test might tip the ‘cricket smarts’ scale a bit back towards the favour of the bowlers.
The theory here is pretty simple: If a bowling side can slow or restrict the number of runs being scored by the batting side, it requires a response that may lead to a greater likelihood of taking wickets.
Here’s what the numbers say:
| Test |
Occurrence |
Rate |
+/- |
| Three Overs Bowled w/ less than 12 runs scored |
2,401
|
8.45%
|
-13.0 %
|
| Three Overs Bowled w/ less than 11 runs scored |
2,215
|
8.71%
|
-10.3 %
|
| Three Overs Bowled w/ less than 10 runs scored |
2,022
|
8.65%
|
-10.9 %
|
| Three Overs Bowled w/ less than 9 runs scored |
1,791
|
8.77%
|
-9.7 %
|
| Three Overs Bowled w/ less than 8 runs scored |
1,524
|
8.79%
|
-9.5 %
|
| Three Overs Bowled w/ less than 7 runs scored |
1,286
|
8.94%
|
-7.9 %
|
| Three Overs Bowled w/ less than 6 runs scored |
1,062
|
8.57%
|
-11.7 %
|
| Three Overs Bowled w/ less than 5 runs scored |
829
|
9.77%
|
+0.6%
|
| Three Overs Bowled w/ less than 4 runs scored |
623
|
10.11%
|
+4.1%
|
| Three Overs Bowled w/ less than 3 runs scored |
435
|
10.57%
|
+8.9%
|
| Three Overs Bowled w/ less than 2 runs scored |
280
|
10.36%
|
+6.7%
|
And thus, batsmen are stupid.
Not really. What this tells me is if a side manages to score six or more runs over a three over period (or, going at two an over or better), they are ‘doing enough’ to ensure pressure isn’t building.
But if they start to slip below that rate, then the ‘see ball, hit ball’ instincts start to kick in, and the batsmen start to take more risks.
And look out dressing room wall if the rate starts to slip below one run per over – the chance of a wicket falling bounces up almost nine per cent. That’s the kind of edge we’re looking for.
Runs matter, according to this analysis anyway, and the pace the batting side is collecting them matters more.
So if that’s the case, then surely the ‘going rate’ of the innings plays a role, too.
Run rates
By ‘going rate’, I mean the cumulative run rate at the end of each over of an innings.
This measures not just the pace that runs are being scored, but the change in the pace that runs are being scored. If a bowling side is able to slow the pace the innings is moving at for extended periods of time, then that scoreboard pressure should be amplified, right?
| Test |
Occurrence |
Rate |
+/- |
| Cumulative Run Rate, falling 2 overs |
987
|
9.12%
|
-6.1 %
|
| Cumulative Run Rate, falling 3 overs |
571
|
10.68%
|
+10.0%
|
| Cumulative Run Rate, falling 4 overs |
329
|
10.33%
|
+6.4%
|
| Cumulative Run Rate, falling 5 overs |
194
|
12.37%
|
+27.4%
|
| Cumulative Run Rate, falling 6 overs |
115
|
14.78%
|
+52.3%
|
Amplified indeed.
While we’re very much into small sample size territory, the results are quite clear. As soon as the bowling side is able to slow the scoring rate of the batting side for three consecutive overs, the EWR begins to jump.
The rate in this sample falls at the four over mark, but then hits the stratosphere, to the point where the likelihood of taking a wicket increases by over 50 per cent. 50 per cent!
This means it’s not just the absolute number of runs a batting side manages to plunder over a certain period of time, but it’s how that compares to what they’ve done in the innings to date.
A great example would David Warner circa 2012 – between his rampant 180 at the WACA against a hapless India (in the 2011-12 summer) and destructive 119 against South Africa in Adelaide (2012-13).
His innings structure looked like this (the dotted line is his ‘expected’ runs based on a career strike rate of 73.4):
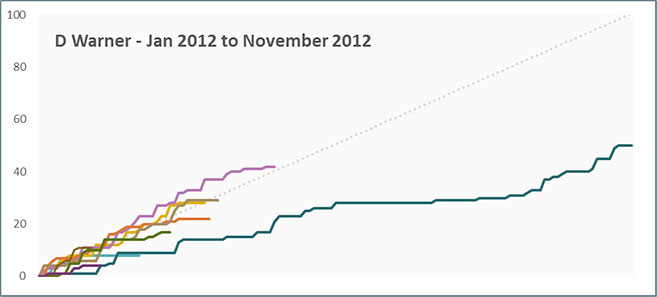
Over those nine innings, Warner scored 211 runs at an average of 23.4, with a strike rate of 53.7. But, amazingly, he scored an even 50 per cent of his runs from boundaries (compared to career marks of 46.5/73.4/54.5).
Warner would get away early – scoring an average of 6.4 runs in his first ten balls – but then dig himself into a hole and hit out, scoring an average of just two runs in his last ten balls. Eight of his nine wickets over this period were catches.
Again, isolation is important, but context matters more.
Innings differences
While we’re dealing with small samples here, there’s just a large enough sample to test whether the stage of the game – as determined by the innings of the match – matters to building pressure this way in situations where the run rate falls for three consecutive overs.
My guess would be it matters most in the second and fourth innings of a match, when a batting side is ‘chasing’ down their opponents total; although the fourth innings ‘hang on for a draw’ factor (AKA The Alastair Cook Special) may mean it’s most effective in the second innings.
Let’s see (the +/- is relative to the EWR for three overs):
| Test |
Occurrence |
Rate |
+/- |
| Cumulative Run Rate, falling 3 overs |
571
|
10.68%
|
+10.0%
|
| Cumulative Run Rate, falling 3 overs, 1st inning |
171
|
11.11%
|
+14.4%
|
| Cumulative Run Rate, falling 3 overs, 2nd inning |
164
|
13.41%
|
+38.2%
|
| Cumulative Run Rate, falling 3 overs, 3rd inning |
112
|
6.25%
|
-35.6 %
|
| Cumulative Run Rate, falling 3 overs, 4th inning |
124
|
10.48%
|
+8.0%
|
Yes, context matters.
The second innings is the innings where pressure is most readily built by slowing the cumulative run rate, while in the third innings, the opposite is true.
Interesting though is the first innings: Perhaps the side batting first feels pressure to set up the game, and if the bowling side manages to curtail an otherwise promising start – say, 2/200 – then a team can fold quicker.
These numbers also imply that batting third may be the innings where there is the least amount of pressure. This could come in two forms: Either the side who starts their second innings first has a lead, or has ample time with which to set one up.
Does that mean batting first is a big advantage? Maybe.
But what it does say is when a side talks about ‘building pressure’, context is what matters. Bowling dot balls in isolation sounds like a great strategy, but really what’s needed to jag a wicket is to be conscious of not just the situation of the game, but also the recent scoring rate of the batsmen.
And the longer a bowling side can build this pressure, the more likely they are to take a wicket.
Perhaps the English were on to something for a while there after all?