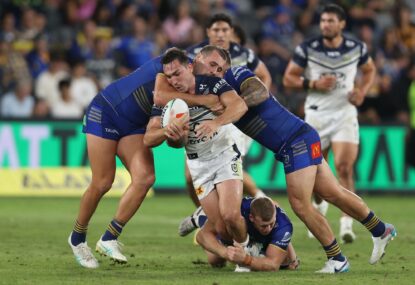
The Roosters take on the Bulldogs at Allianz Stadium in Week 2 of the NRL finals series, while the Sharks travel to Townsville to take on the Cowboys. Here are all the stats that matter this week.
MORE NRL FINALS:
>> WHO WILL WIN THE SEMI-FINALS?
>> ROOSTERS V BULLDOGS PREVIEW
>> COWBOYS V SHARKS PREVIEW
>> EXPERT TIPS
>> HOW TO WATCH NRL FINALS
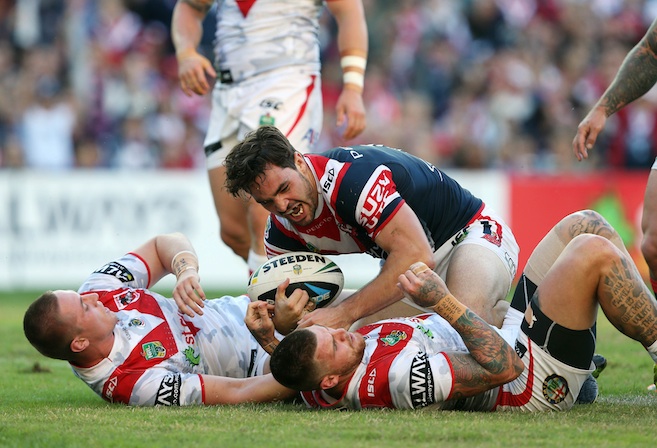
Roosters Vs Bulldogs
7:55pm, Friday 18 September, Allianz Stadium
The History
Overall:
This will be the 175th game between these sides dating back to when Canterbury Bankstown joined the NSWRL in 1935. It stands at 86 to the Roosters, 83 to the Bulldogs, with five draws.
Finals:
This will be the 15th final between these two sides. The Roosters have won six, the Bulldogs eight. The last time these two sides met in a final was the 2004 Grand Final where the Bulldogs won 16 points to 13.
The last ten:
The Roosters have won six out of the last ten games between these sides, including the last three straight. The Roosters beat the Bulldogs 38-28 in round 21 and in round 10 they won 24-10.
At this Venue:
These two sides have played each other at this venue 23 times. It stands at 12-11 in the Roosters’ favour. In the last four encounters the winner has alternated.
Referees:
Matt Cecchin has controlled two games between these sides. Both were won by the Roosters. Ben Cummins has similarly controlled two games between these sides and the Roosters also won them both.
Defence
Team Stats – average per game 2015
| Stat |
Roosters |
Bulldogs |
Difference |
| Line breaks conceded |
2.8 (1st) |
3.4 (3rd) |
+0.6 Bulldogs |
| Missed tackles |
26.2 (8th) |
24.2 (3rd) |
+2 Roosters |
| Trys conceded |
2.2 (1st) |
3.4 (8th) |
+1.2 Bulldogs |
| Meters conceded |
1380 (6th) |
1487 (15th) |
+107 Bulldogs |
| Penalties conceded |
6.8 (11th) |
6.3 (6th) |
+0.5 Roosters |
| Errors |
11.4 (14th) |
10 (8th) |
+1.4 Roosters |
The Roosters concede slightly more penalties than the Bulldogs and they miss slightly more tackles. After that the Roosters defence is clearly better. They concede 107 fewer metres a match than the Bulldogs and 0.6 line breaks. However, the big difference is that they concede over one fewer try per match than the boys from Belmore. The Roosters can get a case of the dropsies. They make nearly 1.5 more errors a match than the Dogs, to be the 3rd worst for that stat this year.
Player Stats
| Stat |
Roosters |
Bulldogs |
| Tackles made |
Jake Friend – 43
Aidan Guerra – 34
Boyd Cordner – 28
Dylan Napa – 28 |
Damien Cook – 50
Michael Lichaa – 45
Aiden Tolman – 38
Josh Jackson – 36
James Graham – 32 |
| Missed tackles |
James Maloney – 4.1
Blake Ferguson – 2.6
Aidan Guerra – 2.6
Dylan Napa – 2.5
Mitchell Pearce – 2.5 |
Damien Cook – 3.8
Moses Mbye – 2.5
Josh Jackson – 2.5
Josh Reynolds – 2.2 |
| Penalties conceded |
James Maloney – 23
Kane Evans – 15
Mitchell Pearce – 12
Dylan Napa – 12
Michael Jennings – 11
Aidan Guerra – 11
Jake Friend – 11 |
Aiden Tolman – 15
Moses Mbye – 14
David Klemmer – 14
Josh Jackson – 13
Josh Reynolds – 12
Frank Pritchard – 10 |
| Errors |
Daniel Tupou – 34
Blake Ferguson – 31
Michael Jennings – 28
Roger Tuivasa-Sheck – 27
James Maloney – 26 |
Sam Perrett – 24
Curtis Rona – 20
Sam Kasiano – 19
Moses Mbye – 18
Frank Pritchard – 18 |
When looking at the players to figure out why the Roosters have a better defence, the first thing that strikes you is how many players the Dogs boast with huge tackling capacity. Four players make over 30 tackles a game. Guerra and Friend do the bulk of the work for the Roosters.
When it comes to missed tackles Damien Cook, Aidan Guerra and Dylan Napa’s aren’t as telling as those made by the backs. For the Dogs the halves of Mbye and Reynolds are the weak links in defence.
However, both are Wayne Pearce reincarnated when compared to James Maloney’s NRL worst 4.1 misses a game. Last week against the Storm he missed 5. The Dogs will work him over the whole match.
No doubt Maloney will concede a few penalties in this game as well. His 23 this season is the 3rd worst in the NRL. As pointed out above, the Roosters can make a lot of errors. Notably Maloney is only the 5th most error prone Rooster. His 26 is two worse than the worst for the Bulldogs, ex-Rooster Sam Perrett.
Attack
Team Stats – average per game 2015
| Stat |
Roosters |
Bulldogs |
Difference |
| Line breaks |
5.1 (1st) |
4.8 (4th) |
+0.3 Roosters |
| Tackle breaks |
34.4 (1st) |
26.3 (10th) |
+8.1 Roosters |
| Trys scored |
4.12 (1st) |
4.04 (4th) |
+0.08 Roosters |
| Meters made |
1550 (2nd) |
1450 (5th) |
+100 Roosters |
| Penalties received |
5.9 (13th) |
5.7 (15th) |
+0.2 Roosters |
The Bulldogs attacking stats this year are pretty good. Fourth for line breaks and tries scored, as well as fifth for metres gained, is nothing to be sneezed at.
However, the Roosters paste them across the board in these stats. The boys from Bondi make huge metres on the back of their ability to break tackles and the line more than any other side this year. Unsurprisingly they have scored the equal most tries this season as a result.
Player Stats
| Stat |
Roosters |
Bulldogs |
| Tackle breaks |
Roger Tuivasa-Sheck – 6.4
Shaun Kenny-Dowall – 3.8
Michael Jennings – 3.4
Daniel Tupou – 3.3
Blake Ferguson – 3.2 |
Brett Morris – 4.6
Josh Morris – 3.0
Sam Perrett – 2.8
Curtis Rona – 2.5 |
| Line breaks |
Daniel Tupou – 19
Roger Tuivasa-Sheck – 15
Blake Ferguson – 13
Shaun Kenny-Dowall -13 |
Curtis Rona – 23
Brett Morris – 16
Josh Morris – 15
Sam Perrett – 10 |
| Metres gained |
Roger Tuivasa-Sheck – 215
Shaun Kenny-Dowall – 125
Dylan Napa – 116
Boyd Cordner – 113
Siosiua Taukeiaho – 111 |
David Klemmer – 139
Aiden Tolman – 138
Brett Morris – 134
James Graham – 119 |
| Trys scored |
Daniel Tupou – 16
Shaun Kenny-Dowall – 14
Roger Tuivasa-Sheck – 11 |
Curtis Rona – 22
Josh Morris – 10
Sam Perrett – 10
Brett Morris – 9 |
| Try assists |
James Maloney – 19
Mitchell Pearce – 13
Roger Tuivasa-Sheck – 10 |
Trent Hodkinson – 11
Moses Mbye – 10
Josh Reynolds – 7 |
| Line break assists |
James Maloney – 14
Roger Tuivasa-Sheck – 10
Michael Jennings – 8
Mitchell Pearce – 6 |
Trent Hodkinson – 9
Moses Mbye – 8
Frank Pritchard – 8
Sam Kasiano – 7
Josh Morris – 6
Josh Reynolds – 6 |
Look at all the Roosters backs who average more than three tackle breaks a game. There’s five of them! Last week Will Chambers did a fantastic job on Michael Jennings. However, one miss and Jennings set up a superb try. Tim Lafai will have his work cut out for him.
The absence of Trent Hodkinson is going to hurt. His 11 try assists and nine line break assists led the way for his team. Mbye and Reynolds have a big job to cover his absence.
The Danger Men
How good is Roger Tuivasa-Sheck! He has run 1,640 more metres than the number two ranked player for that stat, Jesse Bromwich. The average for a player this year is 1237. Roger has done that four times over.
His 159 tackle breaks this season is well over double the Roosters’ best proponent of that skill, Michael Jennings, and his usually impressive 74. Last week the Storm kept RTS to just 183 metres and four tackle breaks for the match. The Bulldogs would want to do something similar or better if they are to be any chance of winning.
In the number one jersey for the Bulldogs is Brett Morris. His 4.6 tackle breaks, 16 line breaks and 134 metres are also pretty impressive. His brother Josh can chime in quite effectively too.
It is no secret that I’m very fond of Josh Reynolds. I believe that he is the key to the Bulldogs chances here. In the absence of playmaker Trent Hodkinson, Reynolds needs to really guide his side around the paddock and get right in the faces of Maloney and Pearce. The absence of Hodkinson has caused a big hole in the Dogs game plan and one that Reynolds can fill, if he is on his game.
Who is going to win and why
There is no question in my mind that the Bulldogs can win this game. I just don’t think they will without Hodkinson. The Roosters are unlikely to lose two in a row, they haven’t done that since April. The Bulldogs are on a six match winning streak but it is notable that the last game they lost was at this venue to the Roosters.
Prediction: Roosters by 1-12.
Cowboys vs Sharks
7:40pm, Saturday 19 September, 1300 Smiles Stadium
The History
Overall:
This will be the 38th encounter between these two sides dating back to 1995 when the Cowboys joined the ARL. To date the Cowboys have won 14, the Sharks 23.
Finals:
These two sides have only met once in the finals. In 2013 the Sharks beat the Cowboys 20-18 in the qualifying final at the Sydney Football stadium.
The last ten:
The Cowboys have a slight advantage having won six of the last ten. However, the Sharks have won both games this season.
At this venue:
There isn’t necessarily a great home advantage here for the Cowboys. They’ve only beaten the Sharks in eight of the 19 encounters at this ground. The last ten games here have been split 50/50, with the Sharks winning here earlier this season.
Referees:
Gerard Sutton has only controlled one game between these sides, in 2012 in Townsville. The Sharks won 20-14. Gavin Badger has refereed three games between these sides. The Sharks won two of them.
Defence
Team Stats – average per game 2015
| Stat |
Cowboys |
Sharks |
Difference |
| Line breaks conceded |
4.2 (7th) |
3.8 (5th) |
+0.4 Cowboys |
| Missed tackles |
25.6 (5th) |
26.5 (9th) |
+0.9 Sharks |
| Trys conceded |
3.2 (5th) |
3.3 (7th) |
+0.1 Sharks |
| Meters conceded |
1341 (2nd) |
1376 (5th) |
+35 Sharks |
| Penalties conceded |
6.2 (5th) |
6.5 (8th) |
+0.3 Sharks |
| Errors |
9.7 (7th) |
10.2 (9th) |
+0.5 Sharks |
The stats suggest that the Sharks don’t fear this ground. On top of that, the Cowboys have been weaker at home than they are on the road, losing four of their twelve games at home this season. The Sharks have won eight of their 12 away games this season, including their last four straight on the road.
While the Cowboys are better in five out of the six above defensive stats, it’s not by very much in any of them and the Sharks defence has been improving all season.
Player Stats
| Stat |
Cowboys |
Sharks |
| Tackles made |
Ethan Lowe – 36
Gavin Cooper – 31
Matthew Scott – 30
Ben Spina – 28
Jake Granville – 28 |
Michael Ennis – 36
Paul Gallen – 34
Andrew Fifita – 30
Luke Lewis – 28
Wade Graham – 28 |
| Missed tackles |
Johnathan Thurston – 2.8
Ethan Lowe – 2.3
Lachlan Coote – 2.1
Michael Morgan – 2.1 |
Luke Lewis – 3.1
Jack Bird – 3.0
Jeff Robson – 2.8 |
| Penalties conceded |
James Tamou – 15
Ethan Lowe – 15
Johnathan Thurston – 13
Jake Granville – 13 |
Michael Ennis – 21
Luke Lewis – 20
Andrew Fifita – 20
Wade Graham – 15 |
| Errors |
Lachlan Coote – 32
Johnathan Thurston – 29
Michael Morgan – 22
Gavin Cooper – 19
Justin ONeill – 19 |
Michael Gordon – 30
Wade Graham – 22
Andrew Fifita – 22
Jack Bird – 20
Valentine Holmes – 18 |
These stats show two pretty evenly matched sides. However, the three missed tackles of Lewis and Bird will have been noted by Thurston.
The Cowboys’ halfback has a superb skill in getting one of his rampant back rowers – often Gavin Cooper – one-on-one with the opposition’s dodgiest defender. The five try rampage against the Eels really showcased that. You can bet that he’ll have Lewis and Bird in his sights.
Conversely, Gallen will be running hard at his opposite captain all night to put the pressure on.
Attack
Team Stats – average per game 2015
| Stat |
Cowboys |
Sharks |
Difference |
| Line breaks |
4.8 (3rd) |
4.8 (4th) |
equal |
| Tackle breaks |
30.3 (2nd) |
29.8 (3rd) |
+0.5 Cowboys |
| Trys scored |
4.12 (1st) |
3.29 (11th) |
+0.83 Cowboys |
| Metres made |
1575 (1st) |
1458 (3rd) |
+117 Cowboys |
| Penalties received |
6.3 (10th) |
7.8 (1st) |
+1.5 Sharks |
The only two stats that really separate these sides are that the Cowboys average nearly one extra try a game and they make 117 more metres a game than the Sharks. Mixed with the fewer metres they concede in defence, the Cowboys have a 152 metres per match advantage over the Sharks.
Interestingly, the Sharks have received more penalties than any other side this year. It’ll be interesting to see if they can will the penalty count up in Townsville.
Player Stats
| Stat |
Cowboys |
Sharks |
| Tackle breaks |
Lachlan Coote – 3.4
Jason Taumalolo – 3.2
Michael Morgan – 3.2
Kyle Feldt – 2.7
Kane Linnett – 2.6 |
Andrew Fifita – 4.1
Jack Bird – 3.5
Michael Gordon – 3.0
Wade Graham – 2.9
Valentine Holmes – 2.5 |
| Line breaks |
Michael Morgan – 19
Justin O’Neill – 14
Lachlan Coote – 11
Jake Granville – 11
Kane Linnett – 11 |
Valentine Holmes – 17
Sosaia Feki – 16
Ricky Leutele – 9
Jack Bird – 9
Luke Lewis – 9 |
| Metres gained |
Jason Taumalolo – 140
James Tamou – 131
Kyle Feldt – 127
Lachlan Coote – 126
Kane Linnett – 126
Matthew Scott – 123 |
Paul Gallen – 202
Andrew Fifita – 150
Wade Graham – 128
Valentine Holmes – 115
Michael Gordon -112 |
| Trys scored |
Antonio Winterstein – 15
Michael Morgan – 11
Jake Granville – 10
Kane Linnett – 10 |
Valentine Holmes -16
Luke Lewis – 11
Jack Bird – 8 |
| Try assists |
Johnathan Thurston – 22
Lachlan Coote – 15
Michael Morgan – 9 |
Michael Ennis – 16
Jeff Robson – 6
Jack Bird – 5 |
| Line break assists |
Johnathan Thurston – 18
Lachlan Coote – 16
Michael Morgan – 9 |
Michael Ennis – 12
Gerard Beale – 10 |
Andrew Fifita was nowhere near his best last week but he still managed 122 metres and five tackle breaks. If he is fit this week expect him to make much larger stats.
Whereas the Cowboys boast a number of line breakers with 10+ to their name, the Sharks are highly dependent on Holmes and Feki on the wings to make the breaks.
Thurston has the most try assists of any player this year but he is also well supported by Coote and Morgan. Conversely, Michael Ennis plays pretty much a lone hand in the try assisting field for the Sharks. Robson and Bird combined fall five short of Ennis’ tally.
The Sharks also rely heavily on the 31-year-old menace in defence. The Cowboys will know how crucial he is and will work him over.
The Danger Men
The key for the Cowboys is always their captain Johnathon Thurston. However, his danger is increased immeasurably by the superb assistance of Coote, Morgan and Granville. It’s a superb attacking spine. If it is fit and on its game the Sharks might not be able to repel it.
Add to that the massive metres of Scott and Tamou and the ever present threat that Jason Taumololo might cut loose and send defenders scattering.
For the Sharks the greatest danger is posed by the disruptive presence of Ennis. Aided by Gallen and Graham, they may be able to put the Cowboys off their stride and grind out a win.
If Andrew Fifita can really take it up to the Cowboys pack it would really be a big help.
Who is going to win and why
Like most people, I’m enjoying the Cronulla fairytale. Last week they played very well. However, they were up against a Rabbitohs side that was imploding and missing many key players. The Cowboys are at full strength, at home and with a bit too much class across the paddock I reckon.
Prediction: Cowboys by 1-12