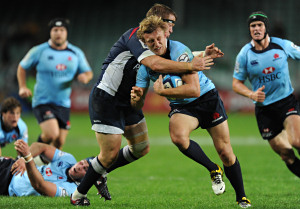
GRAPHIC: Rayasi dislocates finger scoring a try, bravely stays on and scores an even better one
Coming off the bench, he scored a double as the Canes beat the Tahs 41-12.

More local derbies to spark interest was one of the features of this year’s Super Rugby competition, but has it lead to more tries than inter-conference matches?
Unless you are from stereotypical thinking in the northern hemisphere, rugby is about scoring tries. I wanted to know if the derby format impacted on tries.
The concept (and hype) for Super Rugby derbies were that each team in a conference plays each other twice, home and away. While not all teams play each other, there were an equal number of games played in the derbies and inter-conferences, eight a-piece (exception was the round two, Hurricanes versus Crusaders).
By averaging the number of tries in derbies and inter-conference round robin games, I found that some teams had a different number of tries in derbies compared to the number of tries scored in inter-conference matches.
Looking at Australian teams first, the Brumbies have scored the same amount of tries, an average of 2.0 in derbies (i.e. Australian teams) versus an average of 2.0 tries playing inter-conference (i.e. New Zealand and Australian teams) matches. Similarly, the Force averaged 1.6 tries in derbies versus 1.5 for inter-conferences.
The Rebels and the Reds averaged fewer tries in derbies than inter-conferences. The Rebels averaged 1.4 tries in derbies and 2.4 playing inter-conference games; and the Reds 2.4 tries in derbies and 3.3 for inter-conferences.
The Waratahs have a different outcome as they average more tries playing derbies, 3.4 compared with 2.6 tries in inter-conference matches.
The results for the South African and New Zealand teams show in every instance an average of fewer tries scored in derbies versus those scored in inter-conferences.
Comparing the average number of tries in derbies versus inter-conferences for South African teams: the Bulls averaged 2.3 tries versus 2.8; Cheetahs 2.3 versus 3.3; Lions 2.0 versus 2.5; Sharks 1.9 versus 3.3; and Stormers 1.9 versus 2.3.
Comparing the average number of tries in derbies versus inter-conferences for New Zealand teams: the Blues averaged 2.0 tries versus 3.4; Chiefs 1.6 versus 2.5; Crusaders 2.7 versus 3.4; Highlanders 1.5 versus 2.4; and Hurricanes 0.9 versus 3.3.
To compensate for the fact that not everyone played everyone, games were played in different weather, different time zones, different players, different refs and the fact I’m using averages, I applied 95 perc ent confidence intervals.
These are statistical formulas that, if you are unfamiliar, provide a range that you would normally expect another occurrence to fall within 95 percent of the time.
When comparing two groups, in this case the range of derbies tries versus the range of inter-conference tries; you are looking for whether there is an overlap between them. An overlap means no statistical difference. No overlap means a statistical difference.
The only team with a statistical difference was the Hurricanes whose tries in derbies range was 0.2-1.5 versus inter-conference range of 2.0-4.5. Since there is no overlap (i.e. there is a gap between the 1.5 and 2.0) there is statistical difference. Despite the Sharks average of 1.9 tries in derbies versus 3.3 in inter-conferences the ranges were 0.9-2.8 versus 2.0-4.5 respectively, so an overlap meaning not statistically significant.
So did the first year of the Super 15 Super Rugby produce more tries in derbies than inter-conferences overall? No. Did derbies produce fewer tries than inter-conference matches overall?
Yes, but in only the case of the Hurricanes was it statistically significant, and that might have had to do with other things off the field than on it.