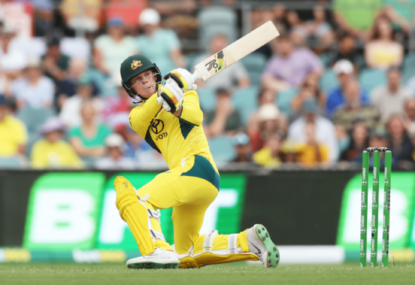
Fraser-McGurk gets belated World Cup call-up - but there's a major catch
Big-hitter Jake Fraser-McGurk will go to the Twenty20 World Cup as a reserve batsman for the Australia squad. Fraser-McGurk's eye-catching IPL scoring has been…

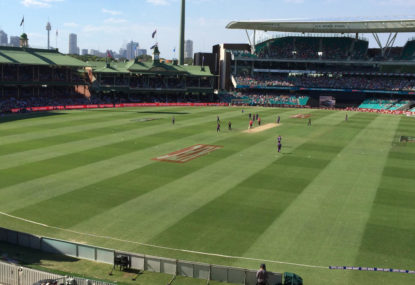
Season 2015-16 was a hugely successful season for the Australian domestic T20 league.
Here are all the crowd figures for Big Bash League 2015-16. Sources are the Channel Ten TV broadcast and austadiums.com.
Average crowds (all matches – highest crowd in brackets)
1. Adelaide Strikers – 43,689 (49,115 v Hobart Hurricanes)
2. Melbourne Stars – 38,824 (80,883 v Melbourne Renegades)
3. Brisbane Heat – 29,353 (33,783 v Adelaide Strikers)
4. Melbourne Renegades – 29,010 (43,176 v Melbourne Stars)
5. Sydney Sixers – 27,956 (38,456 v Sydney Thunder)
6. Perth Scorchers – 20,273 (20,870 v Melbourne Stars)
7. Sydney Thunder – 19,333 (21,500 v Adelaide Strikers)
8. Hobart Hurricanes – 16,640 (18,149 v Perth Scorchers)
The finals were hosted at two venues, Adelaide Oval and the Melbourne Cricket Ground. Taking out the crowd figures for the finals changes, the averages for Adelaide Strikers and Melbourne Stars as follows:
Average crowds – not including finals

Adelaide Strikers – 42,437
Melbourne Stars – 40,986
The following are the top ten crowds for the entire season.
Top ten
1. Melbourne Stars v Melbourne Renegades – 80,883 (MCG)
2. Adelaide v Hobart Hurricanes – 49,115 (Adelaide Oval)
3. Adelaide v Sydney Thunder – 48,699 (Adelaide Oval, Semi Final)
4. Melbourne Stars v Sydney Thunder – 47,672 (MCG, Final)
5. Adelaide v Perth Scorchers – 46,633 (Adelaide Oval)
6. Adelaide v Sydney Sixers – 46,389 (Adelaide Oval)
7. Melbourne Renegades v Melbourne Stars – 43,176 (Etihad Stadium)
8. Sydney Sixers v Sydney Thunder – 38,456 (SCG)
9. Brisbane Heat v Adelaide Strikers – 33,783 (Gabba)
10. Melbourne Stars v Hobart Hurricanes – 33,603 (MCG)
Crowds for the tournament (not including finals)
Total: 903,950
Average: 28,248
Crowds for the tournament (all matches)
Total: 982,823
Average: 28,907
Build your own fantasy cricket team and put it to the test with Draftstars daily fantasy competitions. Pick your match, pick your team and watch the points roll in to take out cash prizes on each match. What are you really gambling with? Set a deposit limit.
Big-hitter Jake Fraser-McGurk will go to the Twenty20 World Cup as a reserve batsman for the Australia squad. Fraser-McGurk's eye-catching IPL scoring has been…

The laws state that a striker is only allowed to play a ball if some part of their bat or person remains within the…
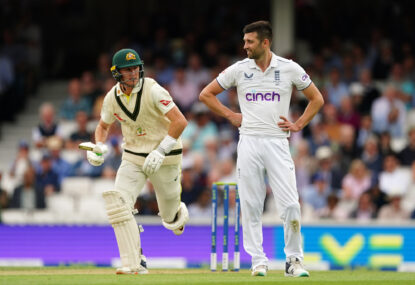
Probably the most popular Aussie in Wales, Marnus Labuschagne rarely lets down the fans at his Glamorgan "second home". The Test batting maestro was…
RCB were initially questioned after bringing Maxi on with the new rock. It worked a treat as he dismissed Ruturaj Gaikwad first ball.
Faf du Plessis took one of the catches of the tournament as Royal Challengers Bengaluru qualified for the IPL playoffs with a 27-run win.…
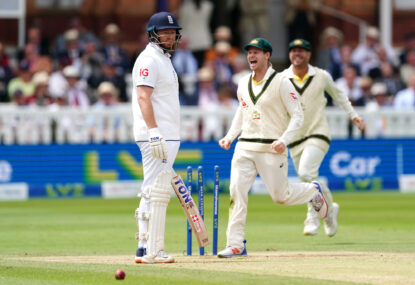
Jonny Bairstow wants to never mention it again and Alex Carey got sick of hearing about it but the firestorm surrounding their dramatic incident…