


- Video
-
Club Roar
Captured a great grassroots sporting moment? We want to see it!Content Collections
The Roar Community
- Join
- Login
If you somehow travelled back in time to the probably smelly streets of Sydney in the early 1900s, you might happen across some of rugby league’s pioneers playing a game with its own style, but a game which still looked a lot like the one they fled, rugby union.
Rugby league evolved slowly after it arrived in Australia and, in some ways, reflected events at a societal level. It was established not long after federation, and both the ‘league game’ and ‘indissoluble’ Commonwealth lived tenuous lives at first.
Then World War II came along and, despite everything, both boomed, with league’s momentum hastening the first epochal divergence from union through limiting tackle counts in 1967, and then the second when it separated attack and defence by 10 metres during the 1993 season.
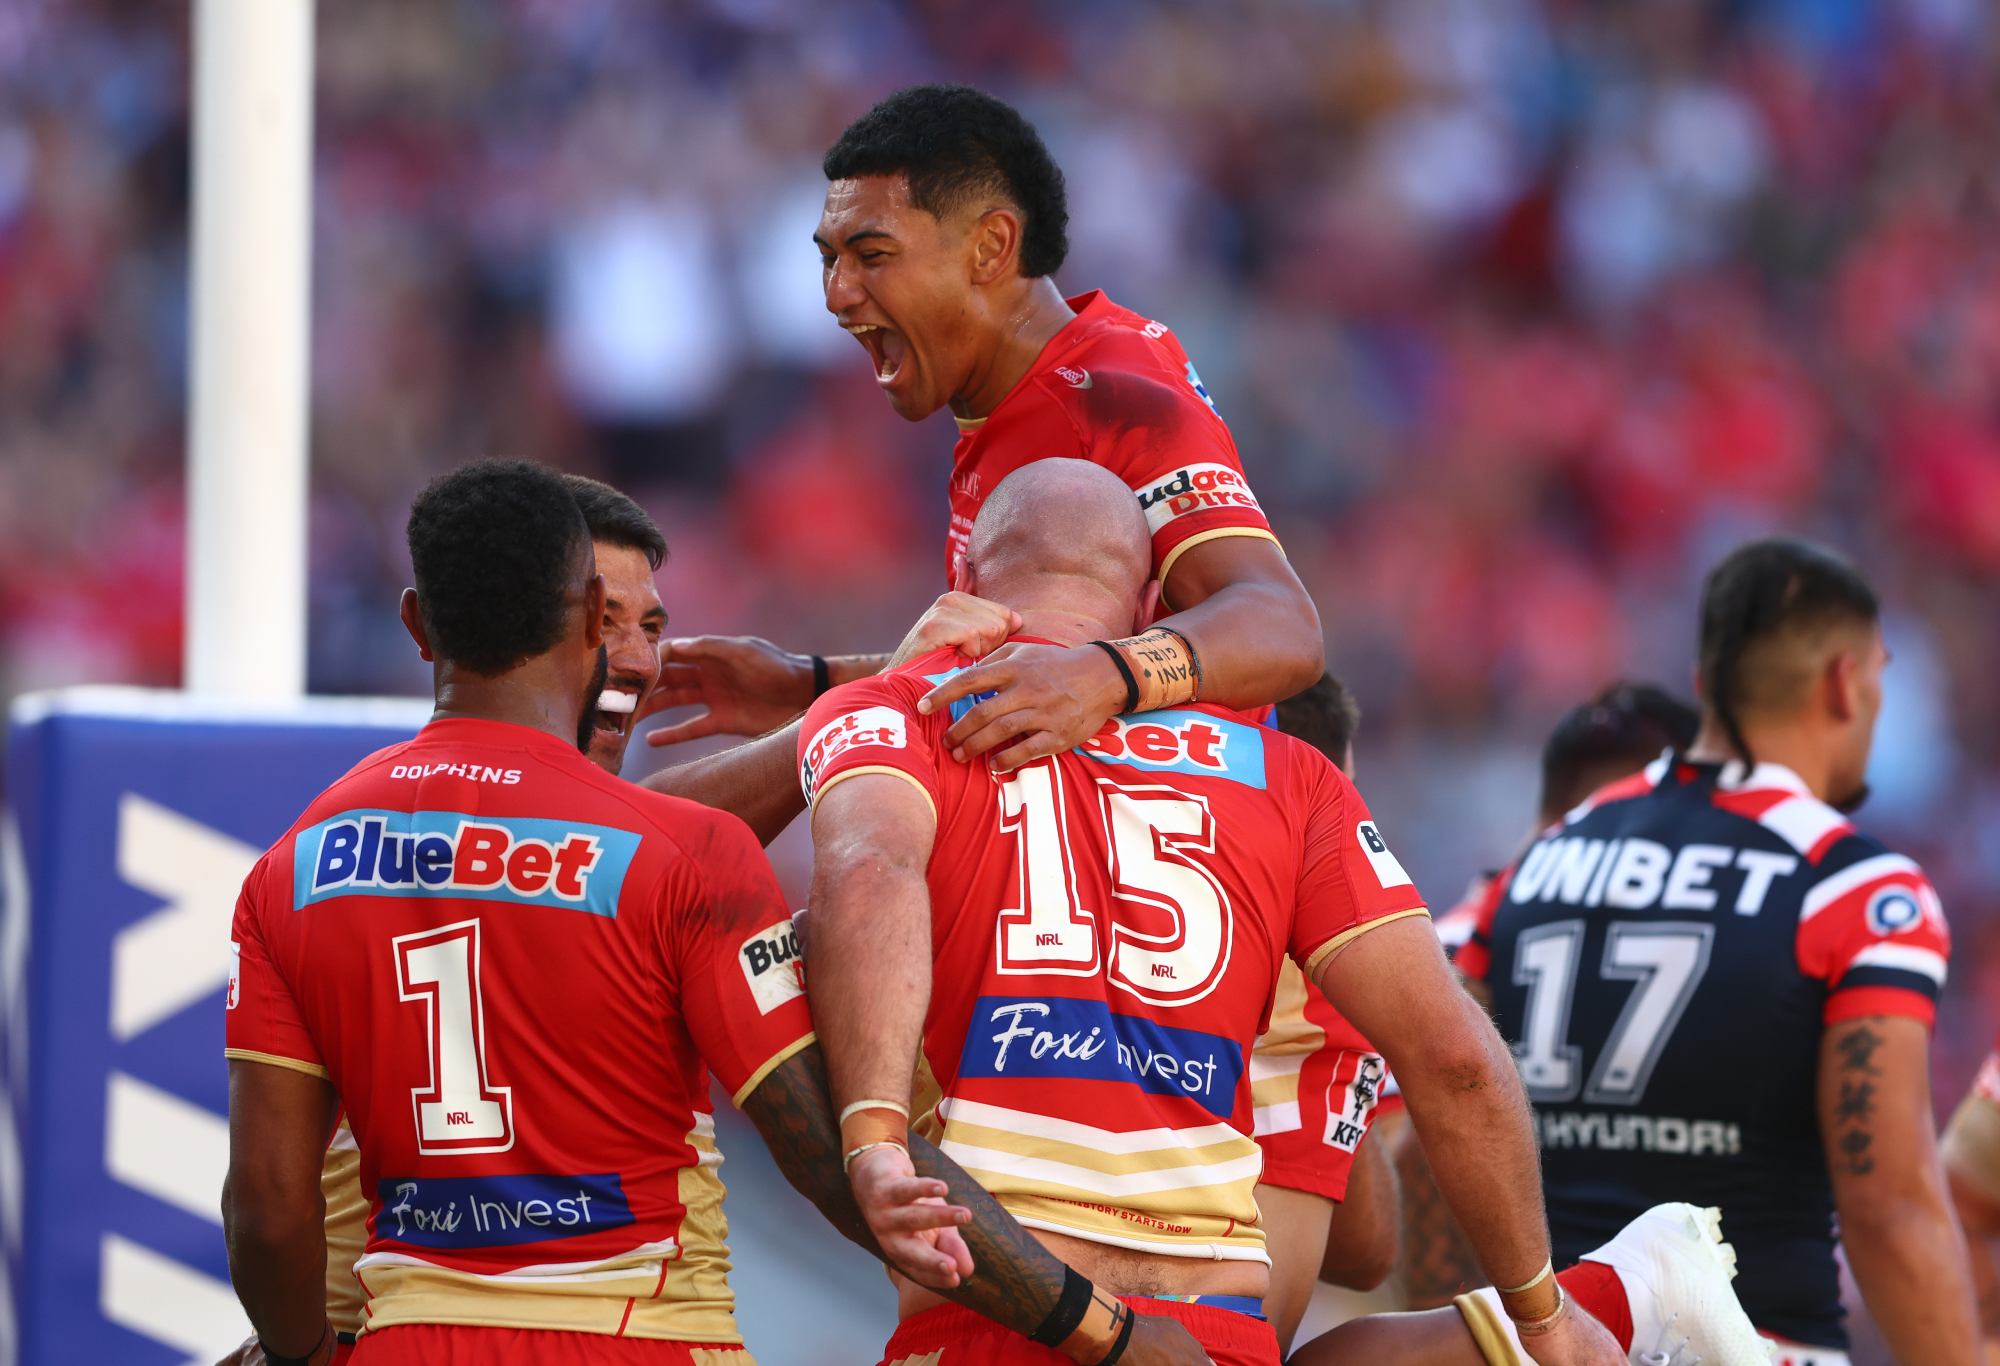
The Dolphins celebrate beating the Roosters in their first ever NRL game. (Photo by Chris Hyde/Getty Images)
So, there are a few distinct eras in rugby league history – at least four of them. Some folk will tell you comparisons between these eras should not be made, but such folk are mostly trying to avoid the strain of thinking about things.
Comparisons between eras can and should be made, with due care and attention, of course. How else are we to understand the history of the game and where we stand in it?
The past may not always have predictive value, but it is relevant experience and you never know when a little piece of history or even trivia might connect with something rattling around in your head and spur an insight.
How else could we recognise that a fifth era of rugby league in Australia might just have commenced?
Some have dubbed this fifth era of rugby league ‘V’landys-ball’, given it covers everything after May 2020 when the NRL Commission and its Chair Peter V’landys ratified rule changes, including removing one on-field referee and replacing many penalties with a six-again call.
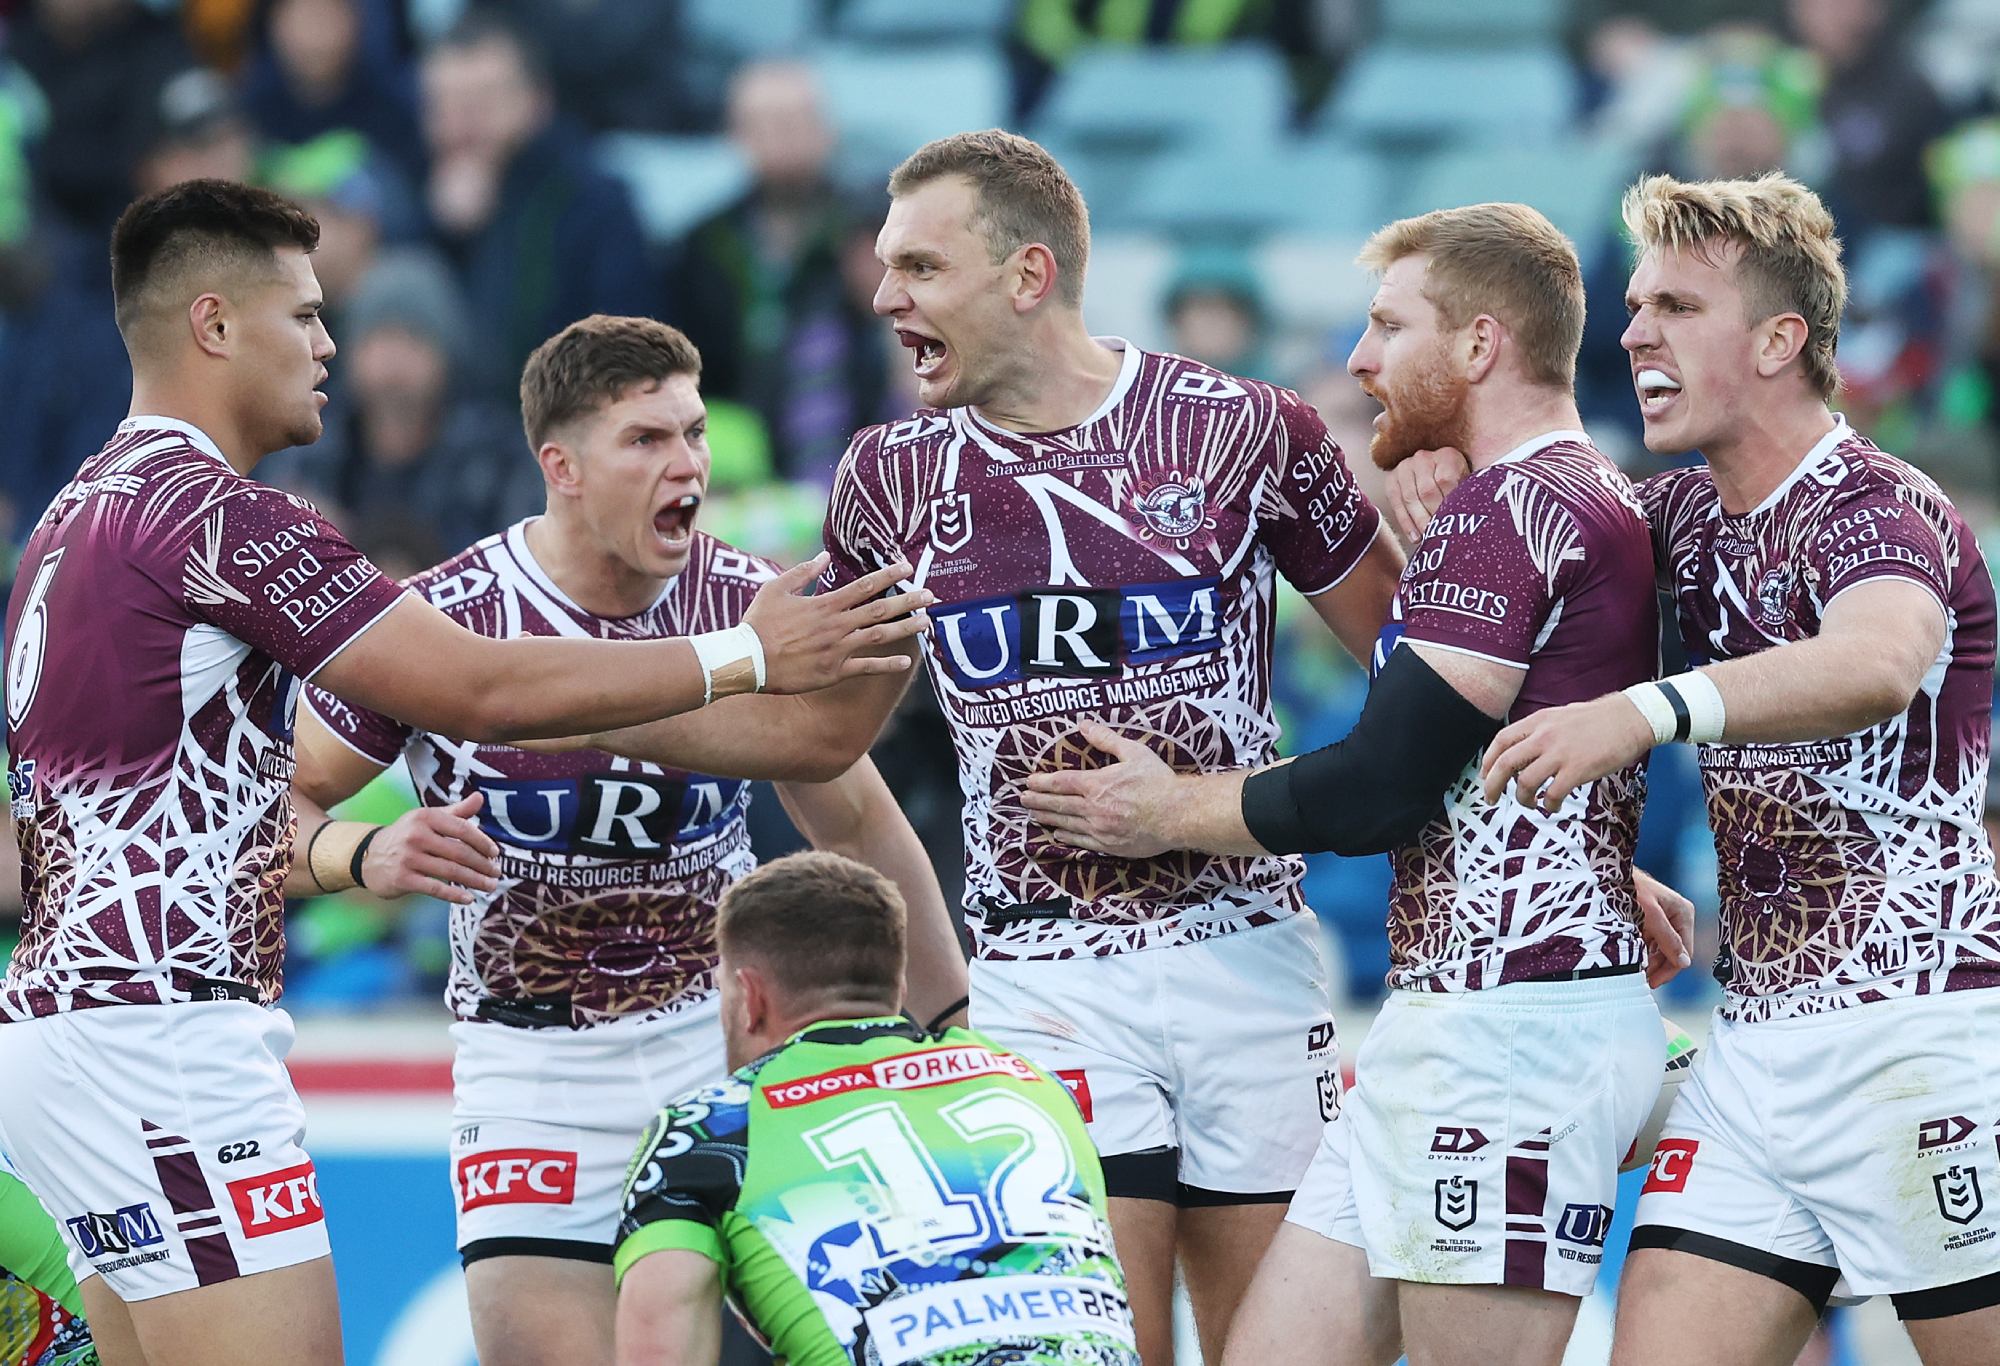
Manly’s Brad Parker celebrates after scoring a try with teammates. (Photo by Mark Metcalfe/Getty Images)
V’landys himself expected the changes to “significantly reduce the number of stoppages in games and showcase more open unstructured play for the benefit of fans… address the issue of wrestling… speed up the ruck and create more free flowing rugby league”.
“No team is going to want to defend multiple sets of tackles without a stoppage in play. This is the greatest disincentive for what has become habitual ruck infringements.”
Four seasons in, even with the tweaks introduced since, ‘V’landys-ball’ can claim some successes. The ball is in play more, ruck-wrestling is no longer rife, and point-scoring has spiked significantly from 2019 levels.
But point-scoring is not yet at historic levels on a prorated basis, the game’s mini Machiavellis (coaches) have moved on to gaming the nexus between penalties and six-agains and many don’t seem to mind defending repeat sets near their own line.
The defining characteristic of this fifth era is something else. Consider the following chart showong the trend in points per game since 1908, along with two lines which indicate the average difference between the best teams and the rest of the field since 1937.
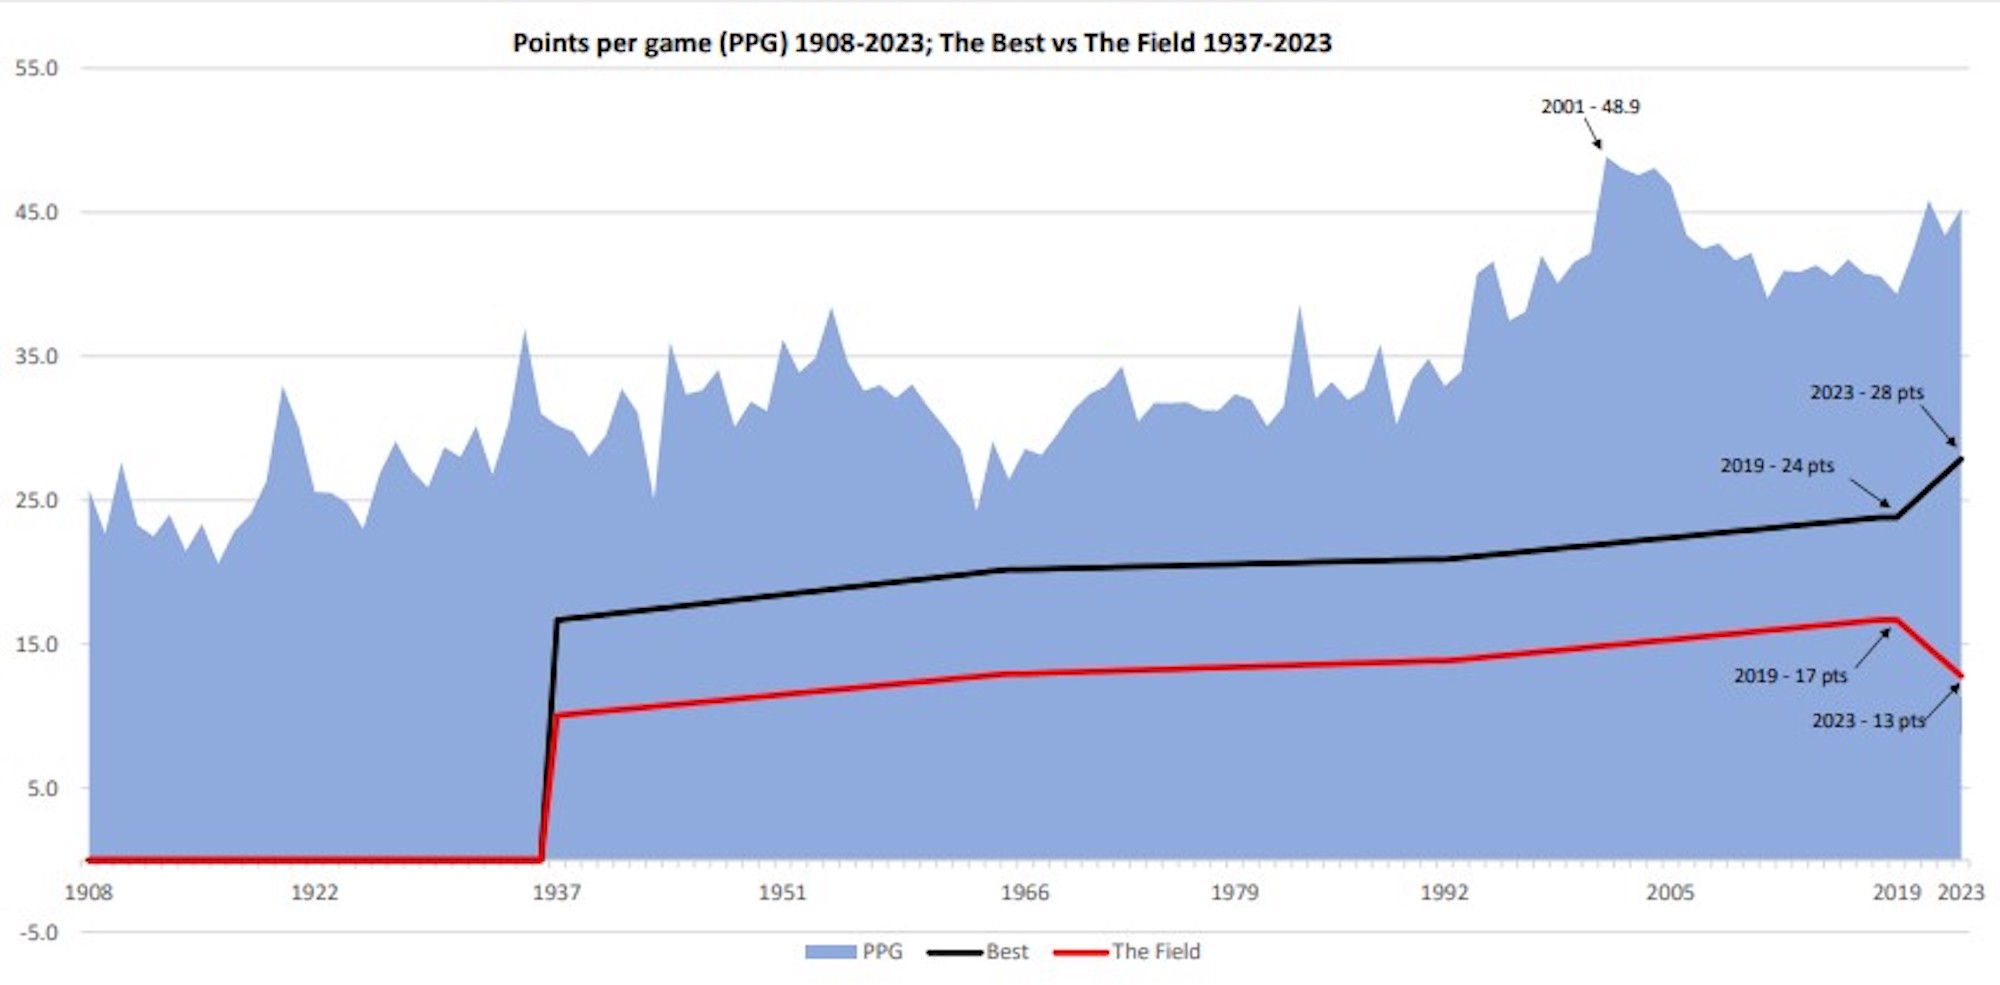
There are some important caveats. The sample is four seasons and 784 games from a total of 116 seasons and 14,417 games. Penrith’s defensive performance since 2020 is nearly off the charts, skews the sample a little and will surely regress toward something more typical, eventually.
The team lines are mere indicators; a reasonable expectation of what the best teams might do on any given day, before some combination of talent, team quality, fatigue, luck and randomness sweep games to their actual end point.
But still, the nascent trend is remarkable – there have been some fluctuations before, but nothing even remotely like the trend since 2020.
A reasonable expectation since is more frequent and intense blowouts. While there are some structural factors at play – teams at different points in their cycle and teams who struggle to attract high-end talent – nobody is immune. Look at the 2023 finals series. The Wests Tigers put 66 points on the Cowboys earlier this season. Penrith have even been touched-up, very occasionally.
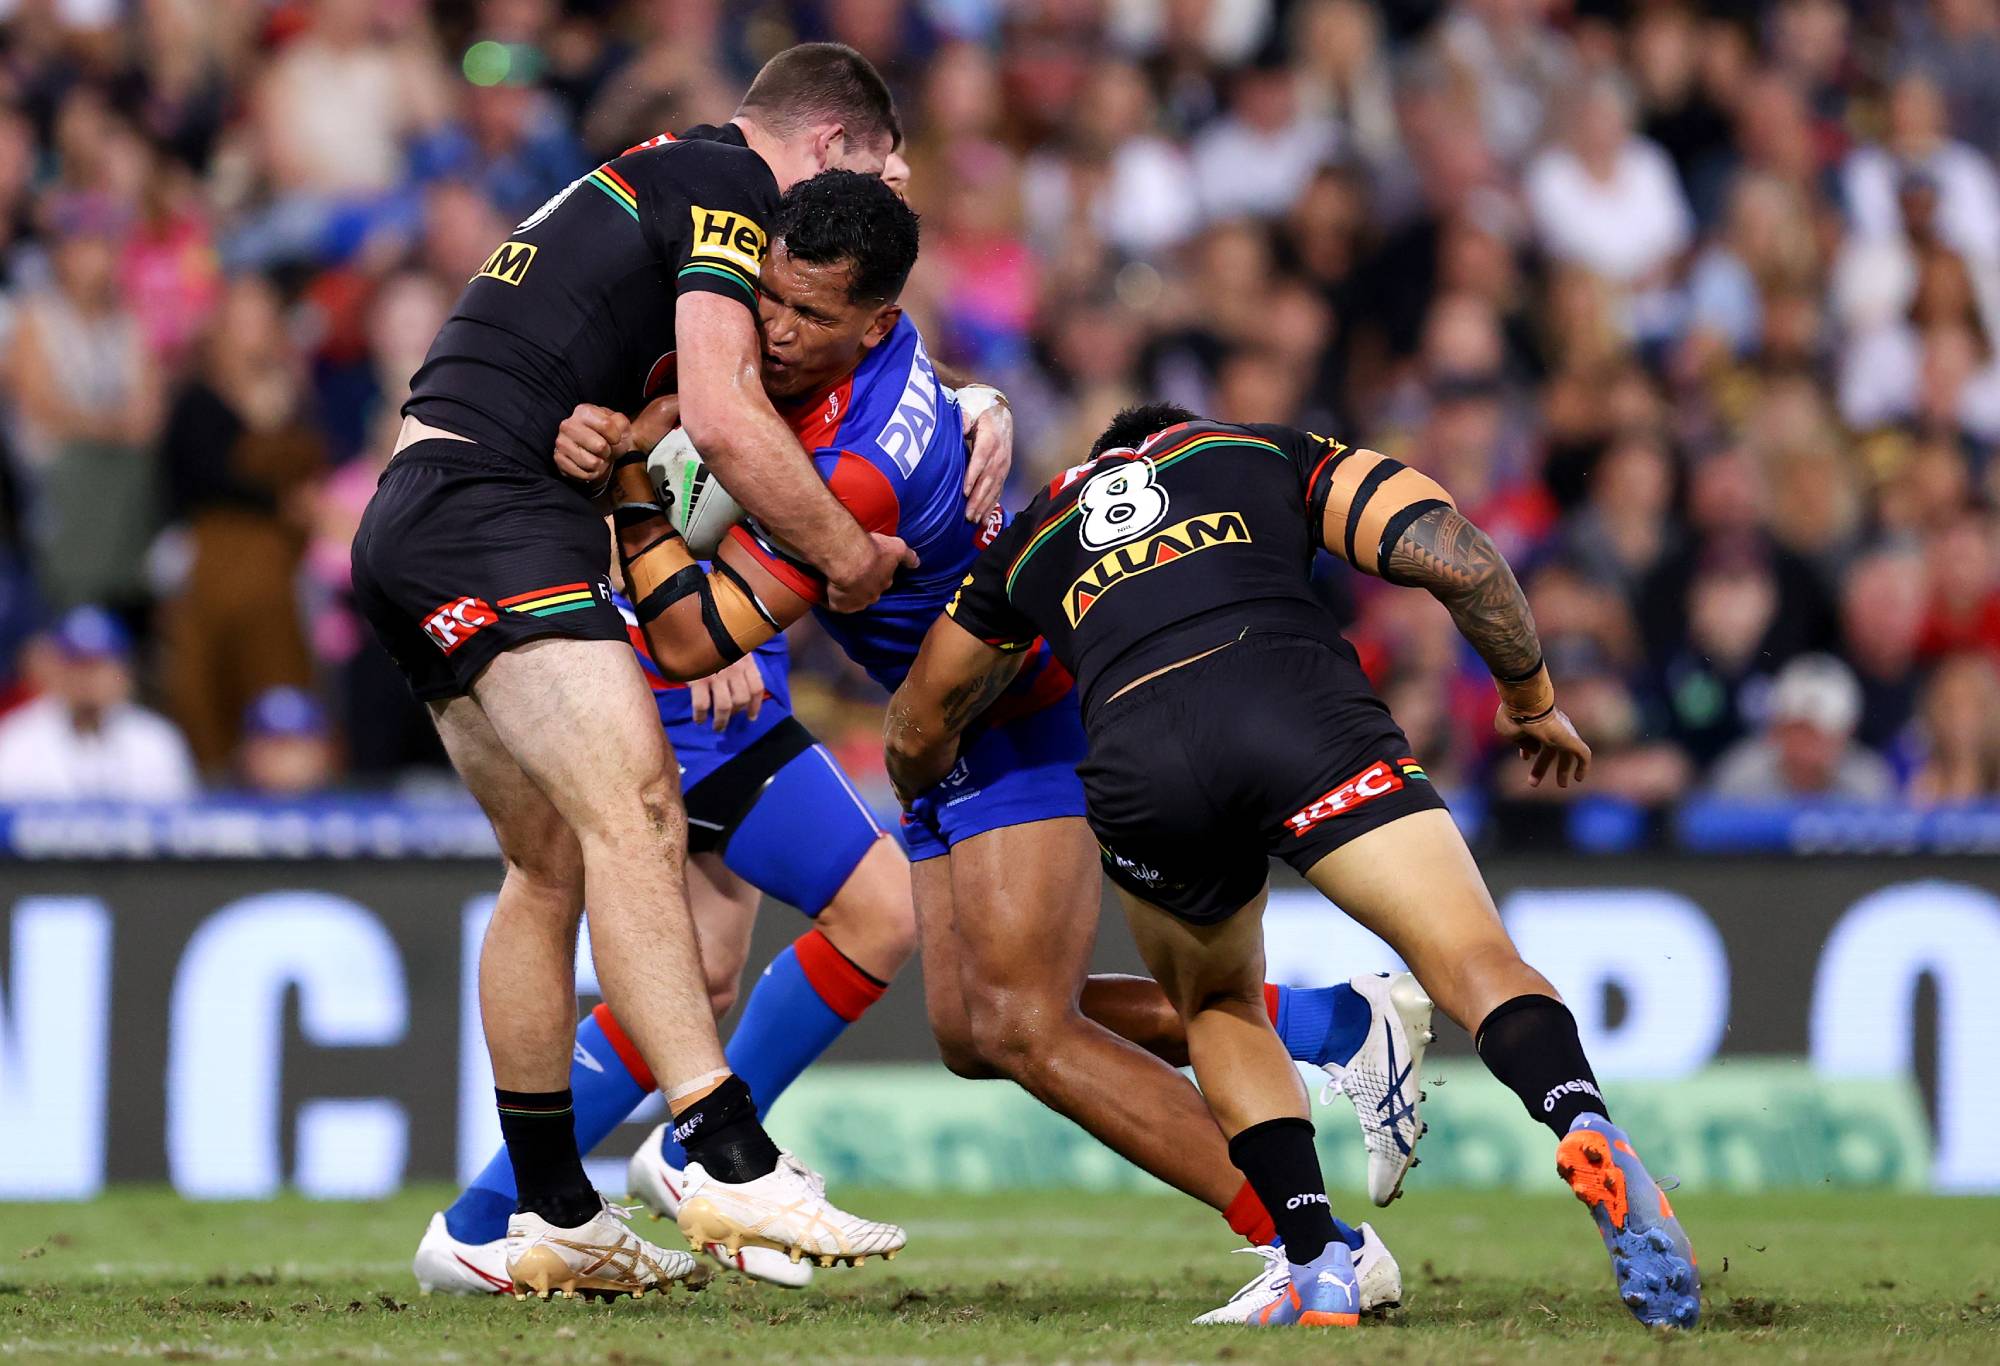
Penrith’s defence is stopping opponents at record pace. (Photo by Brendon Thorne/Getty Images)
The biggest single-year spike in point-scoring during the 20th century was 1935 when Canterbury joined the league and boosted everybody’s points differential. In the fifth era, almost anybody can become 1935 Canterbury on any given day, and then play against 1935 Canterbury the following weekend.
You never know when some useless and arcane trivia might come in handy, so here goes.
Field goals are back in vogue. After falling to a 24-year low (per game) in the COVID-affected 2020 season, one-pointers spiked in 2023 to a very meaningful total of 42, or 0.197 per game. While we may never revisit the golden age of the field goal (1968, 1.49 per game), the conditionally resurrected two-point field goal rule seems to be having an effect.
The league passed 90,000 total points in 2023, and the man who crossed the threshold was Brisbane’s Herbie Farnworth when he crossed the try-line during the Broncos’ preliminary final victory over the Warriors.
It was all happening in round 13 when Newcastle recorded their 400th win, which was also Manly’s 700th defeat. Not to be outshone, North Queensland recorded their 400th defeat the same weekend.
The Cowboys did record their 300th win in round 17 and, unless they forget their way to the try-line, will go past 15,000 points scored in 2024. Penrith will go past 25,000 unless they forget how to score points entirely.
After years of decline, St George Illawarra fell into the red for the first time in 20 years. They’re now 303-316-6 but do still have a positive points differential. On their current trajectory, that will be erased in early 2025.
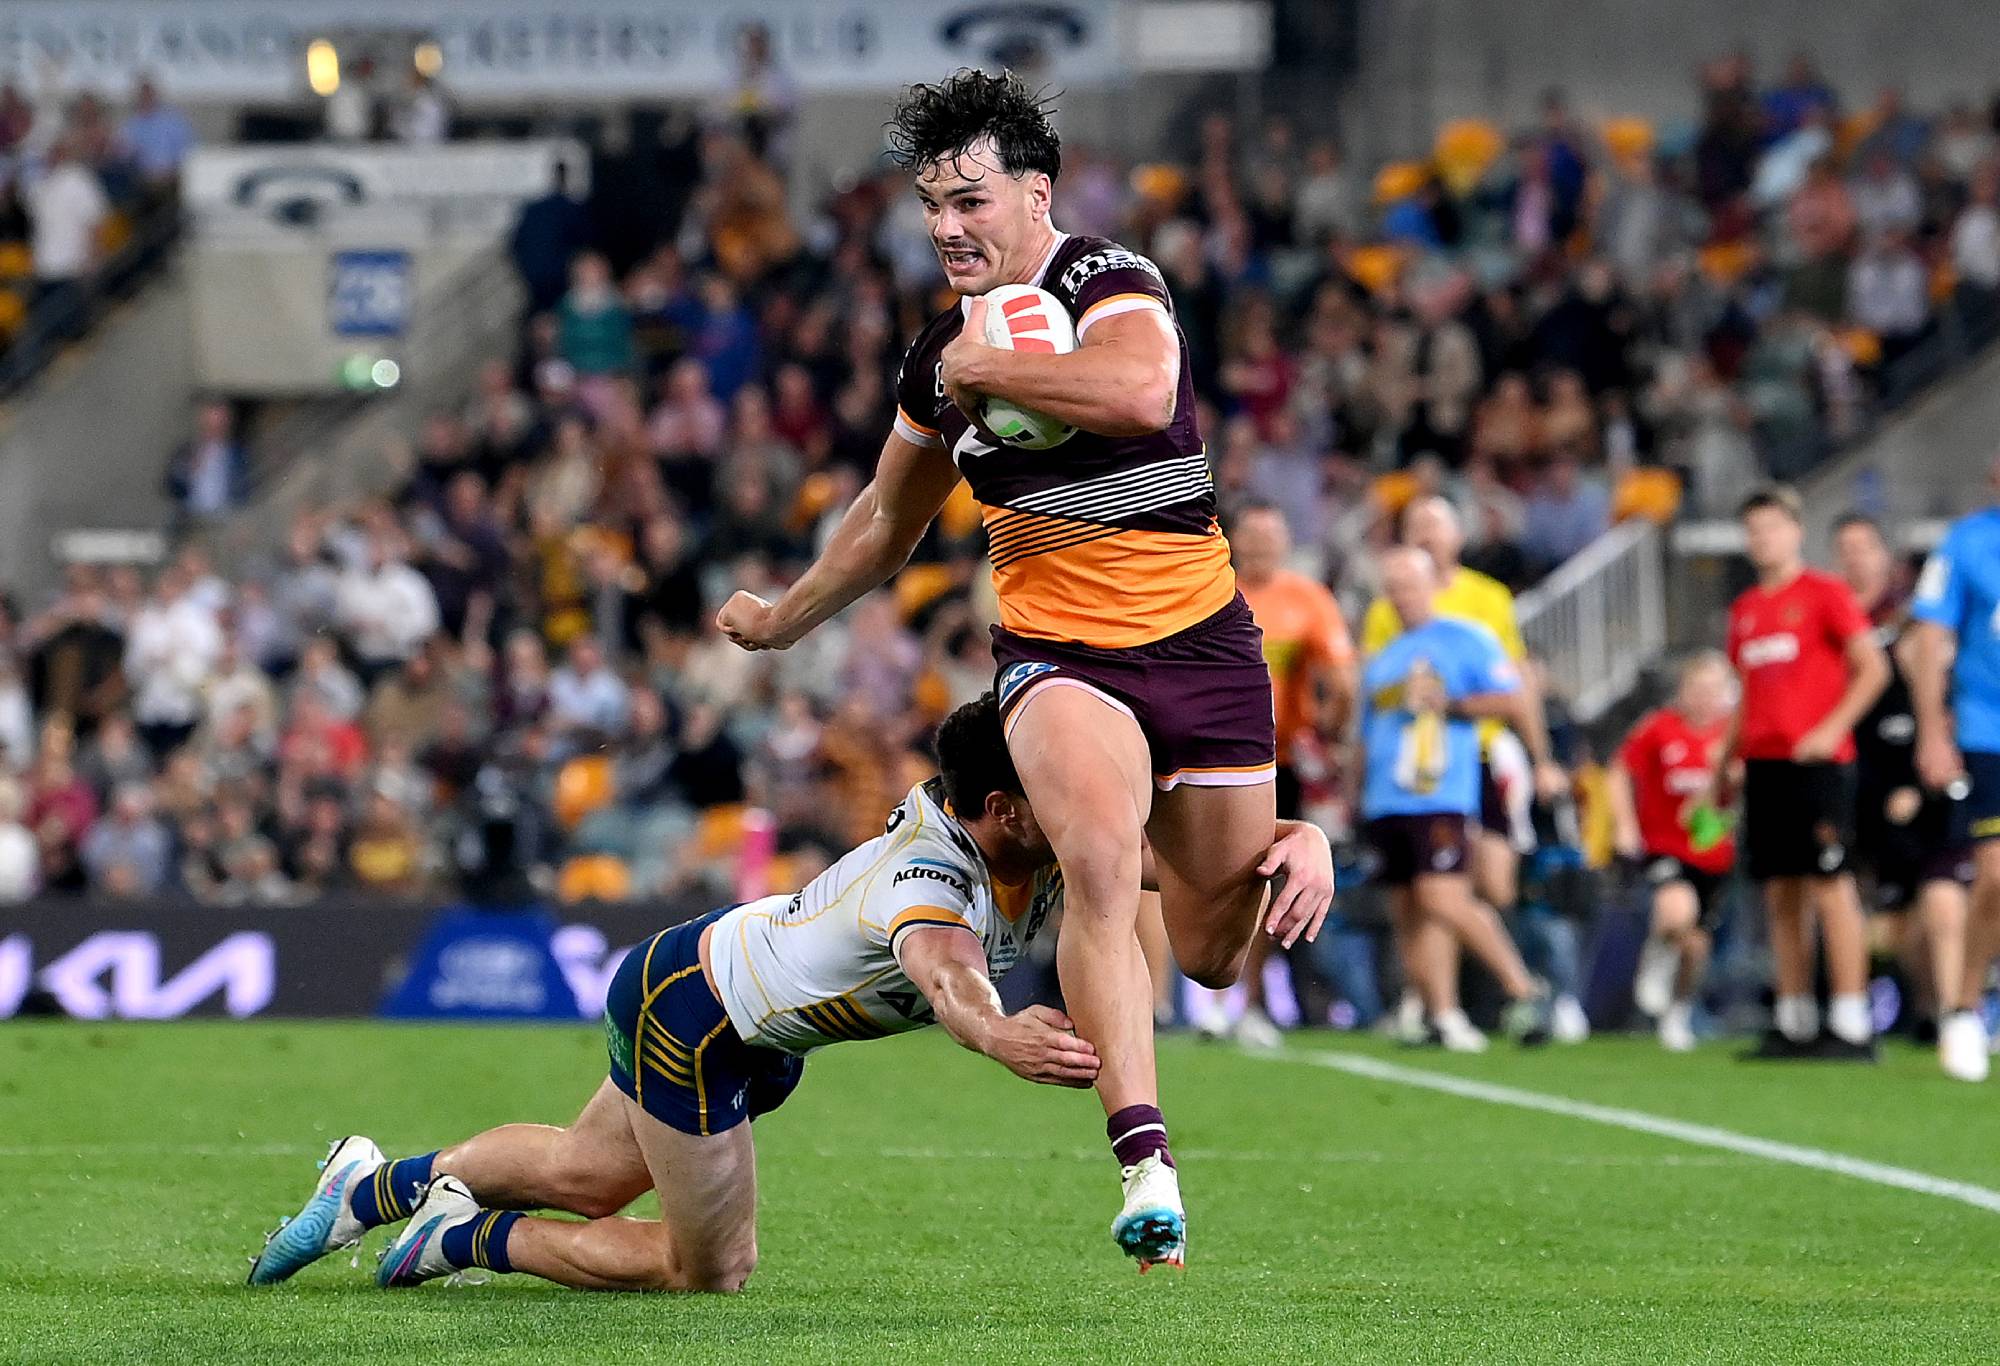
Herbie Farnworth. (Photo by Bradley Kanaris/Getty Images)
Which brings us to the curious case of the Cronulla Sharks, the NRL’s ‘even-Stevens’. They both scored and conceded their 25,000th point in 2023 and are now 670-675-24. A bad season in 2024 could see them become pure even-Stevens. We can only hope.
Regardless, the 2023 season was always going to be interesting because of a new team. While the Dolphins’ precise provenance remains a mystery, they did achieve something of note, becoming just the fourth expansion club since 1908 to win on debut. Everybody knows about the Broncos in 1988, but do you know the other two expansion clubs who won their first premiership game?
There was something else about the Dolphins, though.
If you read my article last year about the 22 unofficial champions of the NSWRL/ARL/NRL, you may have concluded that the concept is absurdly trivial, entirely meaningless and the product of a deranged imagination. I might contest one of those conclusions.
Whatever you think of the concept, the Dolphins became the 23rd unofficial champion after they beat the Warriors in round 27 and, like all bar one of the other unofficial champions, missed the finals. Nobody, with the obvious exception of Souths in 1908, had ever won anything, official or unofficial, in their first season, so kudos to the Dolphins.
The only unofficial champion who played finals football was the 2009 Parramatta Eels, who retained their title by way of the Melbourne Storm’s salary cap rort and subsequent punishments. The nefarious Storm were stripped of five official titles – three minor premierships and two major premierships – none of which have ever been officially filled.
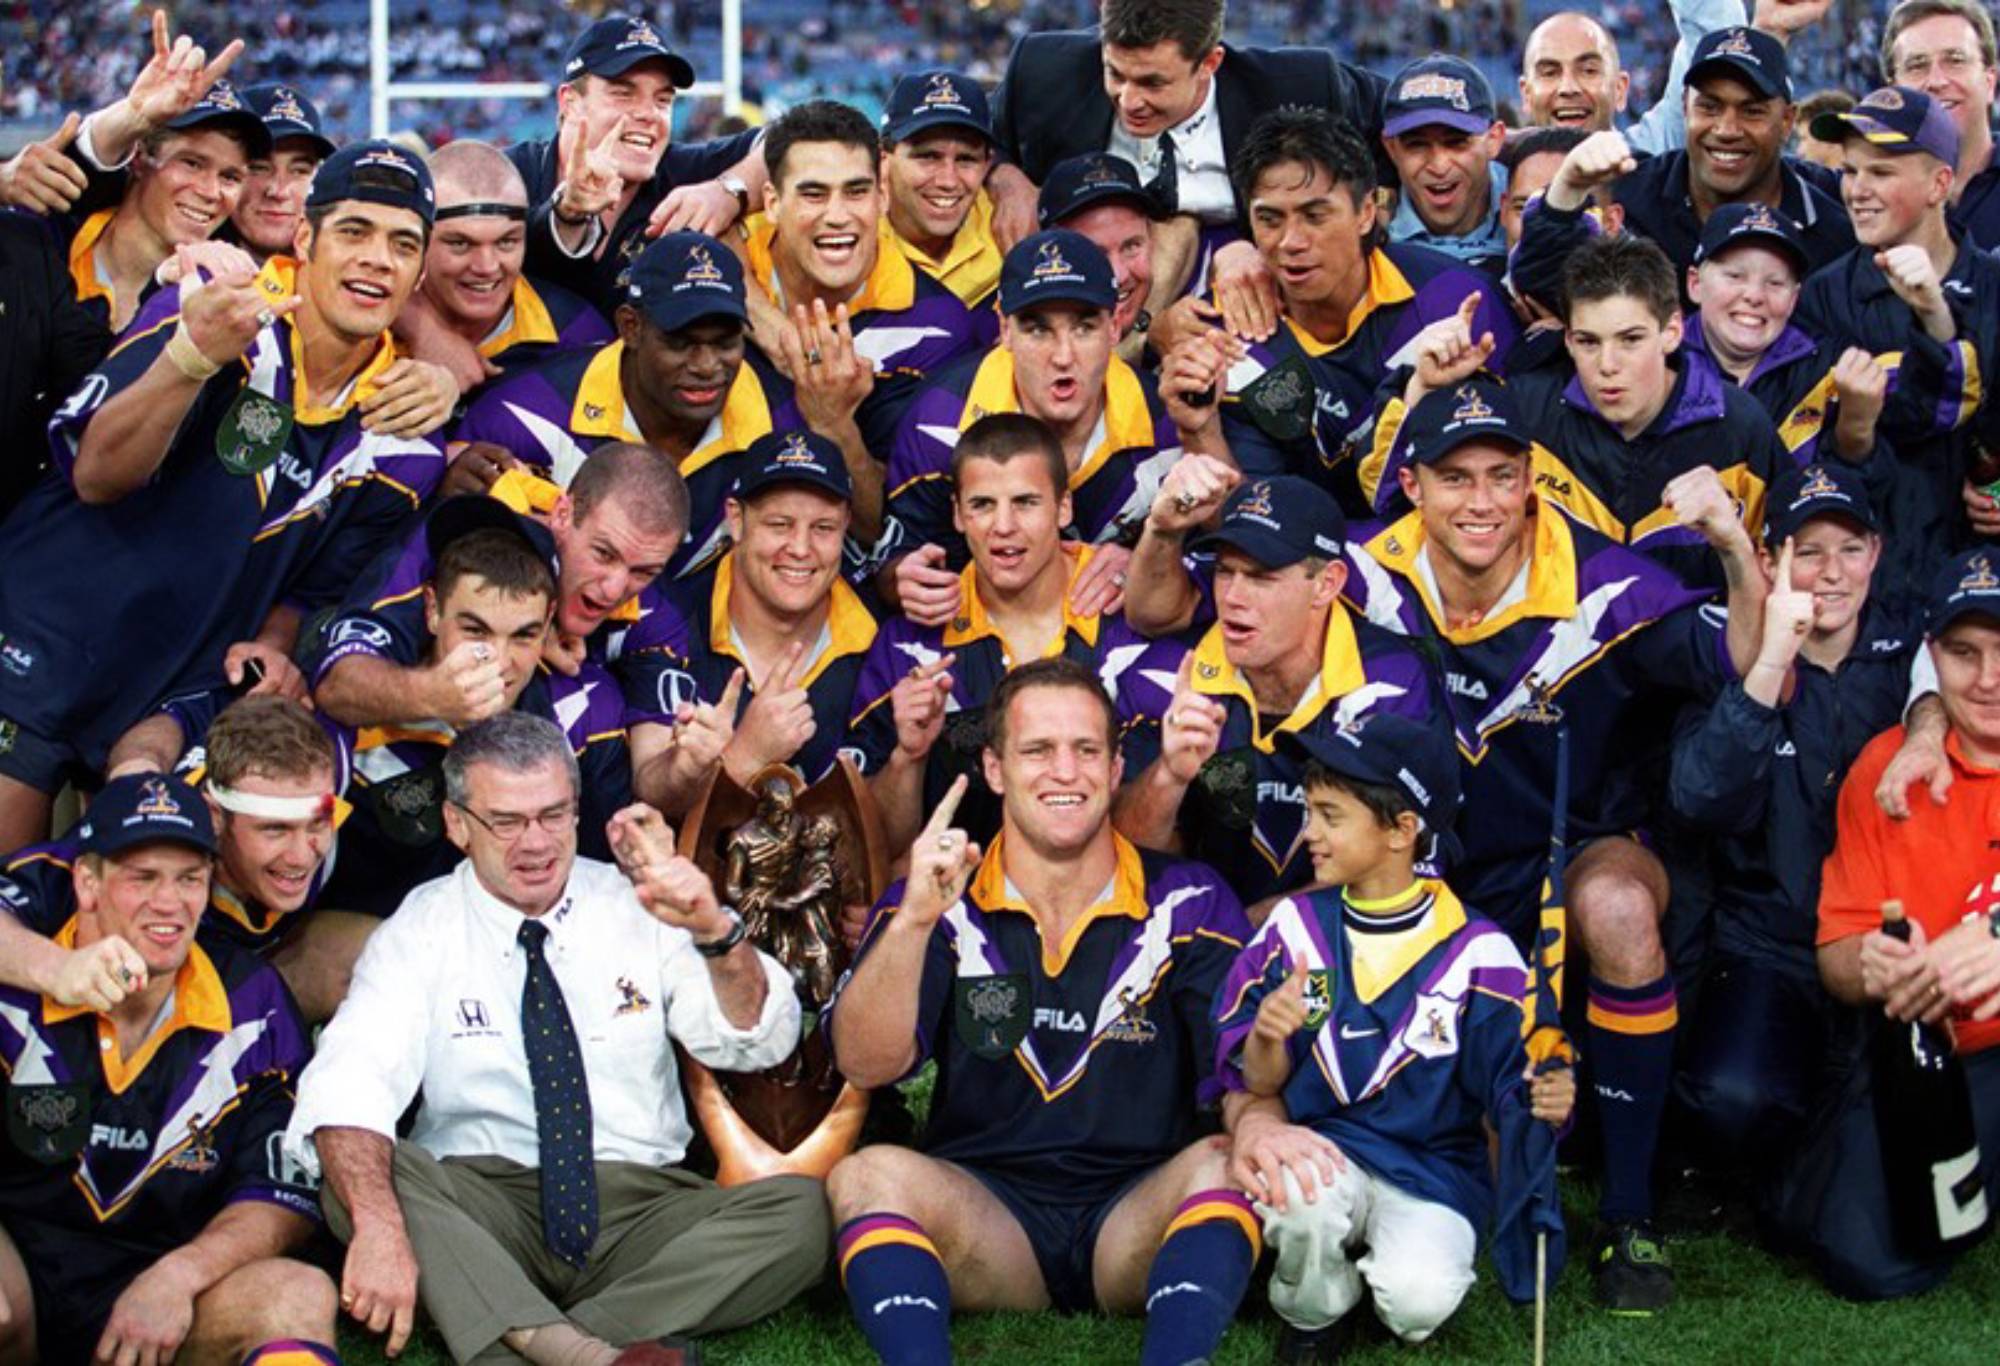
The Melbourne Storm celebrating winning the NRL final inn 1999, with Steve Anderson as their assistant coach. Photo: NRL
Just like nature, the all-time power rankings abhor a vacuum, especially now that the shameless Storm have taken to celebrating premierships rightly stripped. Those titles should be awarded to somebody who deserves them, and they have been in the all-time rankings to follow.
Two of the minor premierships go to Manly (2007 and 2008), with the other awarded to Canterbury (2006). As for the major premierships, it seems rugby league’s unofficial gods have a sense of justice and purpose, because not only was there an unofficial champion in 2009, there was another in 2007: the Sydney Roosters.
With the vacant titles unofficially filled, the time has come to decide who is the greatest team of all. For those unfamiliar with the all-time rankings, this is how it works.
The concept is borrowed from Spanish football, where the Madrid-based tabloid Marca lovingly maintains a table of every team’s performance in La Liga since 1929. Hence, all 34 teams to play in the NRL and its predecessor competitions are included.
The rankings are determined by four measures. The first is ‘actual results’, which is simply the proportion of available competition points won across a team’s history. If your team played ten games, won four, lost four and drew two, their actual results figure is 50%
The second is ‘potential results’. This is a form of points differential expressed as the proportion of results a team could conceivably have gained based on their attacking and defensive records. This is also where the aforementioned ‘due care and attention’ is rigorously applied, with team data separated and compared only within the eras in which they’ve played.

The Roosters hold aloft the 2019 NRL Premiership Trophy. (Mark Metcalfe/Getty Images)
The third is ‘dividend’, essentially titles won as a sort of return on investment. For the sake of simplicity, the total number of titles won by each team is listed rather than the dividend. As at the end of 2023, a total of 251 titles have been awarded. This is every premiership, minor premiership and City Cup since 1908.
Finally, every team has a ‘I-rating’. The ‘I’ stands for Immortal. Long story short, part of calculating potential results involves establishing a comparison group of seven hypothetical teams within each era, ranging from the ‘Invincibles’ through the ‘Medians’ to the ‘Untenables’.
Taking this a step further creates a hypothetical team called the ‘Immortals’. While it is impossible to know how the 13 actual Immortals would fare if they formed a team and played a few thousand games against all-comers over a century or so, the hypothetical Immortals are probably not far off their level. Every team’s I-rating is how they compare to the Immortals.
After all that number crunching, and despite having five titles stripped from them, Melbourne is still statistically the best team in rugby league history. At some point they’ll go into decline, right?
| Team | Games | Actual Results | Potential results | Titles | I-rating | |
| Immortals | 2397 | 73.8 | 84.0 | 64 | 100.0 | |
| 1 | Melbourne | 682 | 66.7 | 69.2 | 9 | 74.4 |
| 2 | St George | 1586 | 59.9 | 65.0 | 31 | 73.4 |
| 3 | Easts | 2397 | 55.3 | 60.5 | 38 | 70.7 |
| 4 | Souths | 2324 | 53.6 | 59.2 | 42 | 69.4 |
| 5 | Manly | 1708 | 57.5 | 62.2 | 19 | 69.2 |
| 6 | Brisbane | 903 | 60.2 | 63.8 | 10 | 68.3 |
| 7 | Balmain | 1766 | 53.1 | 57.9 | 20 | 63.4 |
| 8 | Canterbury | 1951 | 51.5 | 53.5 | 16 | 60.7 |
| 9 | Canberra | 1043 | 51.8 | 56.7 | 4 | 57.6 |
| 10 | Glebe | 354 | 56.4 | 58.3 | 2 | 57.3 |
| 11 | Penrith | 1359 | 47.1 | 55.2 | 10 | 57.0 |
| 12 | Parramatta | 1761 | 47.6 | 53.4 | 10 | 56.9 |
| 13 | Cronulla | 1369 | 49.8 | 55.3 | 3 | 56.3 |
| 14 | Newtown | 1364 | 46.9 | 52.8 | 11 | 54.6 |
| 15 | Wests | 1749 | 44.8 | 50.5 | 12 | 53.5 |
| 16 | St George Illawarra | 625 | 49.0 | 52.1 | 3 | 52.7 |
| 17 | Newcastle Knights | 875 | 47.8 | 52.5 | 2 | 52.0 |
| 18 | Norths | 1730 | 43.1 | 51.3 | 6 | 51.9 |
| 19 | NZ Warriors | 706 | 45.6 | 49.2 | 1 | 48.3 |
| 20 | Newcastle Rebels | 20 | 45.0 | 53.2 | 0 | 47.1 |
| 21 | North Queensland | 714 | 43.0 | 48.0 | 1 | 46.4 |
| 22 | Illawarra | 396 | 40.3 | 49.5 | 0 | 44.2 |
| 23 | Wests Tigers | 585 | 40.9 | 45.0 | 1 | 43.6 |
| 24 | Northern Eagles | 76 | 40.1 | 47.3 | 0 | 42.1 |
| 25 | Hunter | 18 | 38.9 | 48.3 | 0 | 41.8 |
| 26 | Western Reds | 61 | 40.2 | 45.6 | 0 | 41.2 |
| 27 | Gold Coast Titans | 410 | 39.4 | 44.2 | 0 | 41.2 |
| 28 | Dolphins | 24 | 37.5 | 40.7 | 0 | 37.5 |
| 29 | Adelaide | 42 | 32.1 | 38.9 | 0 | 34.1 |
| 30 | Gold Coast-Tweed | 246 | 23.4 | 29.3 | 0 | 25.6 |
| 31 | University | 283 | 22.1 | 25.8 | 0 | 23.4 |
| 32 | South Queensland | 65 | 20.8 | 26.0 | 0 | 22.5 |
| 33 | Annandale | 163 | 17.8 | 20.9 | 0 | 18.7 |
| 34 | Cumberland | 8 | 12.5 | 14.0 | 0 | 12.7 |
Reckon you can pick the winning team? Build your own dream team with Draftstars daily fantasy and compete on any match. For great odds on the NRL head on over to PlayUp. Imagine what you could be buying instead. Set a deposit limit.