On the popular TV show Mythbusters, popularly held beliefs are tested with experiments and data. There are three outcomes: Confirmed, plausible, and busted.
I will look at common myths in relation to backrowers using available stats for the Super Rugby season to date. Most stats are from Fox Fantasy statistics.
The stats have a common scale of per 80 mins to mimic a complete match, so you can compare players who played less minutes.
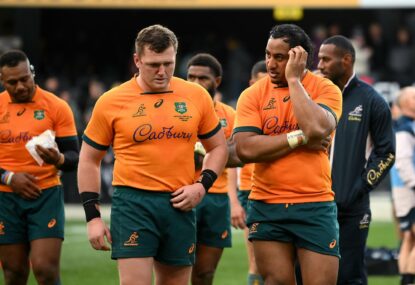
Tatafu Polota-Nau (TPN), Stephen Moore, James Hanson, Nathan Charles have been selected since various quarters push for their inclusion in the Wallaby squad.
Myths about our hookers: (note I am not looking at scrummaging)
TPN has a low contribution / effort.
TPN has a high impact.
TPN is the worst lineout thrower.
Moore and Hanson contribute the most in general play.
Hanson and Charles are underrated.
(Table 1 posted in first comment)
Myth: TPN has a low contribution rate? Busted! He does not have the highest rate but it would be in the middle ground.
Advertisement
Myth: Moore contribute most in general play (ie effort)? Confirmed. Easily the highest.
(Table 2 posted in first comment)
Myth: TPN has a high impact? Confirmed, easily the highest.
(Table 3 posted in first comment)
Myth: TPN is the poorest line out thrower? Busted. Out of every 100 throws he throws 2.2 more not straight than Moore.
Interestingly, Charles is by far the most accurate.
Myth: Hanson is underrated? Busted. He has neither the workrate of Moore nor the impact of TPN, and his throw is just as inaccurate.
Advertisement
Myth: Charles is underrated? Busted. Statistically he is weak in every area except lineout throws.
Editor’s note: PeterK has some nice data in tables, but it was very difficult and time-consuming to format for this article. PeterK will post the tables in the comments.