


- Video
-
Club Roar
Captured a great grassroots sporting moment? We want to see it!Content Collections
The Roar Community
- Join
- Login
Before I begin, let me say this: the 2019 NRL draw is an improvement on last year’s.
Those at NRL HQ had a better go at making a fairer draw this time around. They should get some kudos for that.
However, as we will see as we examine this year’s draw, there is still a fair bit of room for improvement.
Before we look at the draw in depth, there are some realities that once more need to be taken into account.
Free-to-air games
Given broadcasters pay a great deal for NRL rights, there needs to be consideration for putting on games that draw the biggest ratings and generate advertising revenue.
The Broncos, Eels, Bulldogs and Rabbitohs rate well. They are going to get a lot of free-to-air games.
However, free-to-air exposure has a great bearing on a side’s marketability, which translates directly into the amount of sponsorship a side can get. The more sponsorship – including the all-important third-party deals – the more chance a club has of being successful.
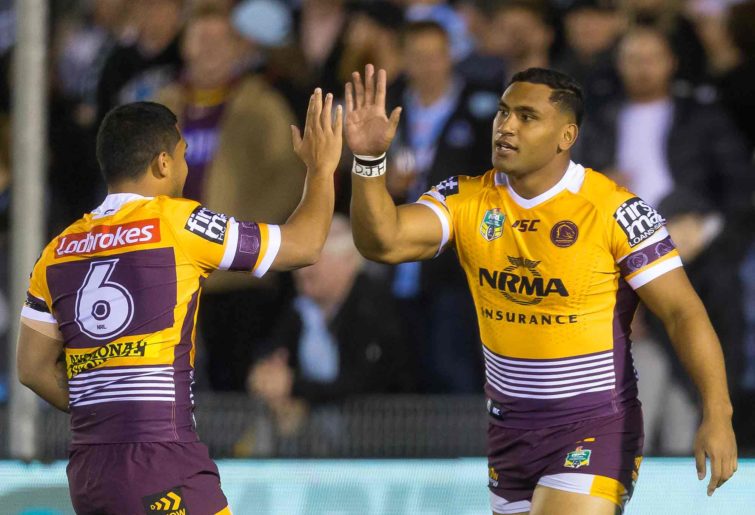
The Broncos get more free-to-air exposure than any other team. (AAP Image/Craig Golding)
If teams receive too large a share of the free-to-air games to please the broadcasters they can become entrenched as successful, while those who get little or no coverage conversely become pigeonholed as unsuccessful.
This aspect has commonly been seen as the main barometer of draw fairness. However, it’s just one of the main components.
Repeat opponents
There are only 24 games per side in the home-and-away season. To play all sides twice there would have to be 30. That would lengthen the season by a month and a half, which – along with State of Origin and internationals – would make the season too long and the demands on players far too high.
This means each team plays six opposition sides only once. This can have a large bearing on a team’s chances. However, who a side plays twice also can have a major bearing on a team’s chances of making the finals.
Location and travel
Nine of the 16 clubs are in Sydney. This, by definition, means that they will not have to travel as much or as far as the Storm, Titans, Knights, Raiders, Broncos and especially the Cowboys and Warriors.
While the draw can allow for this, it can’t make it level. However, the more travel a side has to endure, the less likely they are to win – especially if they are coming up against well-rested, stay-at-home sides.
The NRL must create a draw that limits this type of inequity: especially the dreaded five-day turnaround with significant travel. History shows that a side enduring this disadvantage has only around a one in ten chance of winning.
Last season there were seven instances where a side had a five-day turn around with significant travel. This season there are eight instances.
The geographical realities also have impacts on free-to-air game allocation. As the Cowboys and the Warriors travel the largest distances most frequently, in order to stop them having short turnarounds between games, it makes sense to have their games consistently on the same days.
Saturday has no free-to-air games but is the most logical day to schedule these sides, so as to avoid short turnarounds.
The NRL has the challenge of balancing all of these aspects to create a draw which sees no sides receive too much benefit, nor any get a completely raw deal.
So how did they do this year?
Free to air allocation
Once more the free-to-air allocation features distinct haves and have nots:
| Team | Free to air appearances | Rank | |
| Broncos | 16 | 1 | |
| Wests Tigers | 12 | 2 | |
| Roosters | 12 | 2 | |
| Storm | 12 | 2 | |
| Rabbitohs | 12 | 2 | |
| Panthers | 12 | 2 | |
| Dragons | 12 | 2 | |
| Eels | 12 | 2 | |
| Sharks | 11 | 3 | |
| Bulldogs | 11 | 3 | |
| Cowboys | 10 | 4 | |
| Sea Eagles | 6 | 5 | |
| Raiders | 5 | 6 | |
| Knights | 4 | 7 | |
| Titans | 2 | 8 | |
| Warriors | 1 | 9 | |
By my count there are 75 free-to-air games during this year’s home-and-away season. A fair share of those games would see each side get nine games. As you can see, eleven sides get more than the average and five get far fewer.
It should be noted that the Warriors’ free-to-air showings in the Australian market aren’t nearly as relevant to their ability to garner sponsorship.
However, the Sea Eagles, the Knights, the Raiders and the Titans – as they did last season – once more have been royally screwed over by NRL HQ, who have not even feigned to care about those sides ability to generate sponsorship through this vital exposure.
It is noteworthy that the Sea Eagles are the only Sydney=based club to be treated in such a manner.
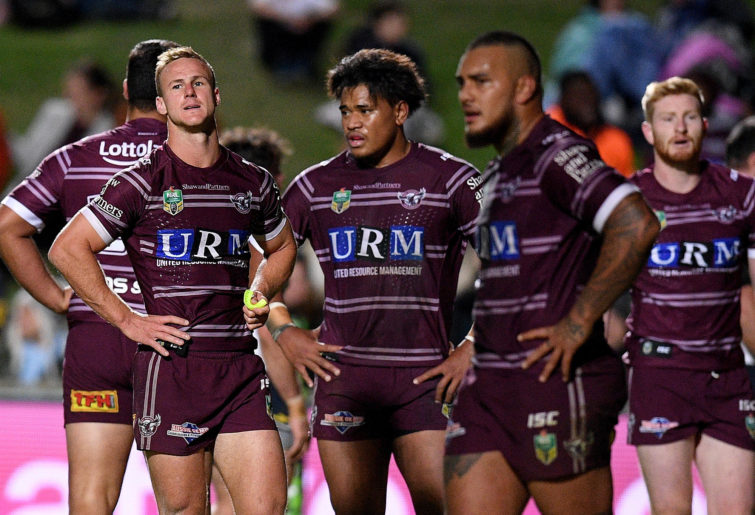
Sea Eagles. (AAP Image/Dan Himbrechts)
I seriously think the Brookvale Boys, along with the Knights, Titans and Raiders should get salary cap concessions to counter this blatant, harmful and totally avoidable inequity.
The Broncos have 16 free-to-air games. However, many of these are on Thursday nights, which are very hard games for their loyal fans to get to as it is a school night and Brisbane traffic is not easy.
The Broncos faithful would really prefer day games on the weekends. Not so the broadcast partners though. They want the Broncs on every TV as often as possible as they pull big viewer numbers, and with those numbers the advertising dollars.
Significant travel
Let’s first make clear that travel from Sydney to Wollongong, Newcastle, Canberra, Gosford or Bathurst is not significant travel. However, there is area fair few decent trips that sides must endure.
So who travels the most?
| Team | Significant travel | Rank | |
| Storm | 13 | 4 | |
| Warriors | 12 | 3 | |
| Cowboys | 12 | 3 | |
| Titans | 11 | 3 | |
| Broncos | 10 | 3 | |
| Raiders | 6 | 2 | |
| Panthers | 6 | 2 | |
| Wests Tigers | 5 | 2 | |
| Sharks | 5 | 2 | |
| Sea Eagles | 5 | 2 | |
| Rabbitohs | 5 | 2 | |
| Knights | 5 | 2 | |
| Eels | 5 | 2 | |
| Dragons | 4 | 1 | |
| Bulldogs | 4 | 1 | |
| Roosters | 3 | 1 | |
It should be of absolutely no surprise that five of the seven non-Sydney clubs do the most significant travel to games. The Storm have the hardest time of it this year with 13.
Conversely, the Roosters have only three big trips – one of which is their home game that they take to Adelaide. So of the five possible long away trips they could have been allocated they are only doing two.
However, this is really a reality of the competition. Even Todd Greenberg can’t be blamed for this issue.
Games against the 2018 top four
| Team | Games vs 2018 top four | Rank | |
| Rabbitohs | 4/6 | 1 | |
| Sharks | 4/6 | 1 | |
| Roosters | 5/6 | 2 | |
| Storm | 5/6 | 2 | |
| Knights | 5/8 | 2 | |
| Eels | 5/8 | 2 | |
| Titans | 6/8 | 3 | |
| Sea Eagles | 6/8 | 3 | |
| Wests Tigers | 6/8 | 3 | |
| Warriors | 7/8 | 4 | |
| Raiders | 7/8 | 4 | |
| Panthers | 7/8 | 4 | |
| Bulldogs | 7/8 | 4 | |
| Cowboys | 7/8 | 4 | |
| Dragons | 7/8 | 4 | |
| Broncos | 8/8 | 5 | |
Usually two or three of the previous season’s top four repeat the effort. So how many games you are drawn against those sides can have a big impact on a sides chances. The most aside can possibly get drawn to play is eight times, the least is three.
The Sharks and the Rabbitohs are the winners this season. Both finished in the top four in 2018 and only possibly play six games in this category. They both did a third better than that.
Conversely, the Broncos got screwed on this one. They’ve drawn all four sides twice. Not ideal for the Broncs…
Games against the 2018 top eight
| Team | Games vs 2018 top eight | Rank | |
| Dragons | 10/14 | 1 | |
| Panthers | 11/14 | 2 | |
| Storm | 11/14 | 2 | |
| Wests Tigers | 11/16 | 2 | |
| Sharks | 12/14 | 3 | |
| Rabbitohs | 12/14 | 3 | |
| Knights | 12/16 | 3 | |
| Roosters | 12/14 | 3 | |
| Sea Eagles | 12/16 | 3 | |
| Eels | 12/16 | 3 | |
| Warriors | 12/14 | 3 | |
| Broncos | 12/14 | 3 | |
| Raiders | 13/16 | 4 | |
| Bulldogs | 13/16 | 4 | |
| Cowboys | 13/16 | 4 | |
| Titans | 14/16 | 5 | |
The most games a side can be drawn to play in this category is 16. The fewest is seven. The Titans couldn’t be too happy with this result, especially on the back of their travel load and barely being sighted on free-to-air. But, hey, it’s only a Gold Coast iteration.
Who cares, right?
On the other end of the spectrum the Dragons have to be pretty pleased with this aspect. Now if they could just get some luck in regards to their playing roster…
Games against the 2018 bottom eight
| Team | Games vs 2018 bottom eight | Rank | |
| Titans | 10/14 | 5 | |
| Bulldogs | 11/14 | 4 | |
| Cowboys | 11/14 | 4 | |
| Raiders | 11/14 | 4 | |
| Roosters | 12/16 | 3 | |
| Warriors | 12/16 | 3 | |
| Rabbitohs | 12/16 | 3 | |
| Sharks | 12/16 | 3 | |
| Broncos | 12/16 | 3 | |
| Sea Eagles | 12/14 | 3 | |
| Knights | 12/14 | 3 | |
| Eels | 12/14 | 3 | |
| Storm | 13/16 | 2 | |
| Panthers | 13/16 | 2 | |
| Wests Tigers | 13/14 | 2 | |
| Dragons | 14/16 | 1 | |
These rankings, of course, are the inverse of the above table. The Titans once more get the rough end of the Pineapple. The Dragons get the juicy yellow flesh.
Games against the 2018 bottom four
| Team | Games vs 2018 bottom four | Rank | |
| Roosters | 4/8 | 5 | |
| Eels | 4/6 | 5 | |
| Cowboys | 4/6 | 5 | |
| Titans | 5/6 | 4 | |
| Sea Eagles | 5/6 | 4 | |
| Bulldogs | 6/8 | 3 | |
| Rabbitohs | 6/8 | 3 | |
| Warriors | 6/8 | 3 | |
| Panthers | 6/8 | 3 | |
| Broncos | 7/8 | 2 | |
| Storm | 7/8 | 2 | |
| Wests Tigers | 7/8 | 2 | |
| Raiders | 7/8 | 2 | |
| Knights | 7/8 | 2 | |
| Sharks | 7/8 | 2 | |
| Dragons | 8/8 | 1 | |
Those who were of the impression that Uncle Nick Politis ran the game should look at the Roosters draw against the 2018 cellar dwellers. They get the absolute minimum.
Once more the Dragons get a very good result though. It should be noted that the Raiders and Knights don’t get shafted in this regard.
Five-day turn arounds
There are two sorts of five-day turn arounds: those with no significant travel between the games, and those with a long trip added to the burden. The second is a far harsher assignment. Sides who have to add a long haul to a short break almost always lose.
| Team | Five-day turn arounds without travel | Five-day turn arounds with significant travel | Total | Rank | |
| Wests Tigers | 2 | 1 | 3 | 4 | |
| Bulldogs | 3 | 0 | 3 | 4 | |
| Raiders | 0 | 2 | 2 | 3 | |
| Storm | 1 | 1 | 2 | 3 | |
| Broncos | 1 | 1 | 2 | 3 | |
| Titans | 1 | 1 | 2 | 3 | |
| Eels | 1 | 1 | 2 | 3 | |
| Roosters | 2 | 0 | 2 | 3 | |
| Sharks | 2 | 0 | 2 | 3 | |
| Dragons | 2 | 0 | 2 | 3 | |
| Cowboys | 0 | 1 | 1 | 2 | |
| Knights | 1 | 0 | 1 | 2 | |
| Sea Eagles | 1 | 0 | 1 | 2 | |
| Rabbitohs | 0 | 0 | 0 | 1 | |
| Panthers | 0 | 0 | 0 | 1 | |
| Warriors | 0 | 0 | 0 | 1 | |
As stated above, last year there were seven incidents of five-day turnarounds with significant travel. This year there are eight.
The fact that the NRL managed to have the Raiders experience one in just Round 2 of the competition – playing a side coming off an eight day break – suggests that perhaps not too many f%#ks are given about the side from Canberra by those at Moore Park.
The Raiders in fact must endure two this season. Getting one each are the Broncos, Storm, Eels, Wests Tigers, Cowboys and – of course – the Titans. The Rabbitohs, Panthers and Warriors have no five day turn arounds of any sort.
Receiving five-day turn arounds
If it is a burden to get five-day turn arounds it follows that it is really good to receive sides who have played just five days earlier. So who does well here?
| Team | Receiving five-day turn arounds without travel | Receiving five-day turn arounds with significant travel | Total | Rank | |
| Panthers | 3 | 1 | 4 | 1 | |
| Roosters | 4 | 0 | 4 | 1 | |
| Warriors | 1 | 2 | 3 | 2 | |
| Rabbitohs | 2 | 1 | 3 | 2 | |
| Broncos | 2 | 1 | 3 | 2 | |
| Titans | 1 | 1 | 2 | 3 | |
| Storm | 0 | 1 | 1 | 4 | |
| Sharks | 0 | 1 | 1 | 4 | |
| Cowboys | 0 | 1 | 1 | 4 | |
| Wests Tigers | 1 | 0 | 1 | 4 | |
| Raiders | 1 | 0 | 1 | 4 | |
| Bulldogs | 1 | 0 | 1 | 4 | |
| Sea Eagles | 1 | 0 | 1 | 4 | |
| Eels | 1 | 0 | 1 | 4 | |
| Dragons | 0 | 0 | 0 | 5 | |
| Knights | 0 | 0 | 0 | 5 | |
The Panthers and the Roosters are very much on the happy side of par here. This is amplified for the Panthers as they don’t have one single five-day turn around themselves.
The Rabbitohs also are laughing in that regard too. The Dragons get no favours here and neither do the Knights.
So how do we evaluate all this to see the winners and losers? It’s far from an exact science, but I’ve chosen to add each teams rank in each category together. The sides with the lowest cumulative scores have the most favourable draws, those with the highest tally have the worst.
So what does that look like?
| Team | Cumulative rank score | Overall draw rank | |
| Rabbitohs | 17 | 1 | |
| Panthers | 17 | 1 | |
| Dragons | 18 | 2 | |
| Roosters | 20 | 3 | |
| Wests Tigers | 21 | 4 | |
| Storm | 21 | 4 | |
| Sharks | 21 | 4 | |
| Broncos | 22 | 5 | |
| Eels | 24 | 6 | |
| Sea Eagles | 26 | 7 | |
| Knights | 26 | 7 | |
| Bulldogs | 27 | 8 | |
| Warriors | 28* | 9 | |
| Raiders | 29 | 10 | |
| Cowboys | 30 | 11 | |
| Titans | 34 | 12 | |
*Warriors lack of Australian free-to-air games isn’t as relevant in the New Zealand market.
Six of the seven sides who have the best overall 2019 draw are from Sydney. The Rabbitohs and Panthers have zero excuse for missing the 2019 finals with their draws.
Backing the Rabbitohs to make the top four is easy money. The Dragons should be very thankful for the mercy of this draw and the Roosters just a touch behind them.
There is no mistaking that the Titans have been totally screwed over here. This is a pathetic and inequitable draw for them.
An administration with any integrity would not have allowed this to occur to a side. It would be kinder and far more merciful to just wind them up now. This treatment is just too cruel.
However, the almighty broadcast deal requires eight games so the Titans will continue to be pushed punch drunk back into the ring each week for more beatings.
Are you not entertained?
While this draw is an improvement on last year’s abomination, there is still a lot of improvement that needs to be made if the NRL is to produce a vaguely fair draw.