


- Video
-
Club Roar
Captured a great grassroots sporting moment? We want to see it!Content Collections
The Roar Community
- Join
- Login
Opinion
In my ongoing review of cricket’s great statistical questions, this time we shall talk about the second greatest insult in cricket: the flat track bully.
It is the Adam Voges anomaly. Do some great records mask the dreaded flat track bully?
Adam Voges is such a statistical outlier that he could easily be used as an example for nearly every anomaly you could think of, but I will just tackle one here.
Firstly, Voges has a fairly decent average of just 542.0 against the West Indies, plus a not too shabby 99.0 against NZ. His average against the rest? Only 20.5 against a combination of England, South Africa and Sri Lanka.
Give Voges a flat pitch and a pop gun attack and for a short period of time he was better than anyone in history at cashing in. Add some spice to the pitch and line him up against good bowlers and he was very, very mortal.
Voges is the most obvious example of a player filling his boots such that his basic record needs to be read with a great deal of scepticism. However there are others.
(Mark Kolbe/Getty Images)
In the early days of cricket, South Africa were nowhere near Test standard when the English bowler George Lohmann took 35 wickets at a bowling average of just 5.8 in a three-match series in 1896. To be fair, Lohmann also averaged a pretty handy 13.01 in 15 matches against Australia, so he went alright bowling on the less than pristine pitches of the day.
The legendary SF Barnes, often in the conversation for world’s greatest bowler, took his 83 wickets against South Africa at a miserly 9.85 compared to 106 wickets at 21.58 against Australia.
In more recent times Matt Hayden briefly held the batting innings world record after pummelling 380 runs against a hapless Zimbabwe team whose bowling attack comprised Heath Streak, Andy Blignaut, Sean Ervine, Ray Price and Trevor Gripper. Incidentally it was the part-timer Gripper who eventually dismissed Hayden. Gripper followed up his two first innings wickets with a fighting 53 to make the race for man of the match a tight affair!
Brian Lara’s twin Everests of 375 and 400 were both on featherbeds against England teams of the era that could best be described as modest, but they are never discounted because, you know, it was England. The 1994 England attack was Angus Fraser, Andy Caddick, Phil Tufnell, Chris Lewis and Graeme Hick. While there are some handy bowlers there, none will threaten any all-time lists.
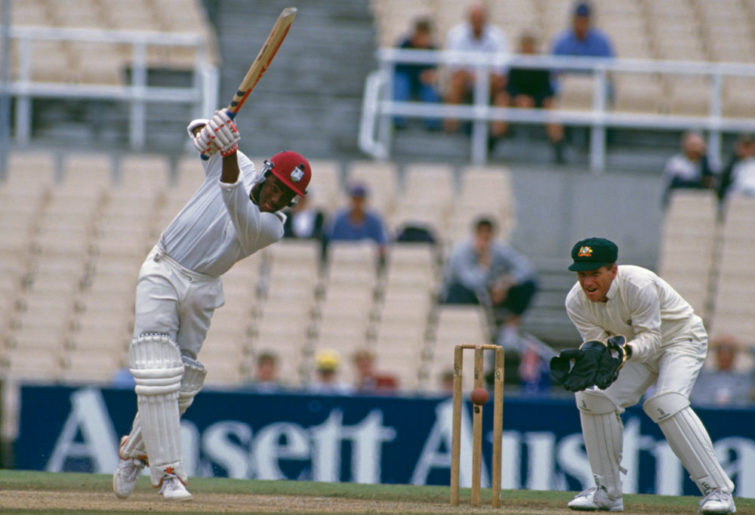
(Photo by Joe Mann/Getty Images)
A decade later the England attack Lara demoralised looked on the surface to be very strong: Matthew Hoggard, Steve Harmison, Andrew Flintoff and Simon Jones. But a closer look at the scoreboard shows the not quite great Gareth Batty bowling 52 overs for 185 runs, ably supported by a combined 31 overs from noted batsmen Michael Vaughan and Marcus Trescothick for a combined 0-128).
Both Lara games were tame draws. The mid 1990s hopeless English batting line-up put on 593 to nearly take a first innings lead and in 2004 England finished their second innings on a comfortable 5-422. I’m going out on a limb and saying the pitch was probably a bit dead.
Who decides if an opposition is too weak for achievements against them to count? At times the West Indies, Sri Lanka, New Zealand, South Africa and even India and Pakistan have been very weak, especially when they first entered Test cricket. The post-Lara West Indies were at times likely just as poor as Bangladesh or Zimbabwe.
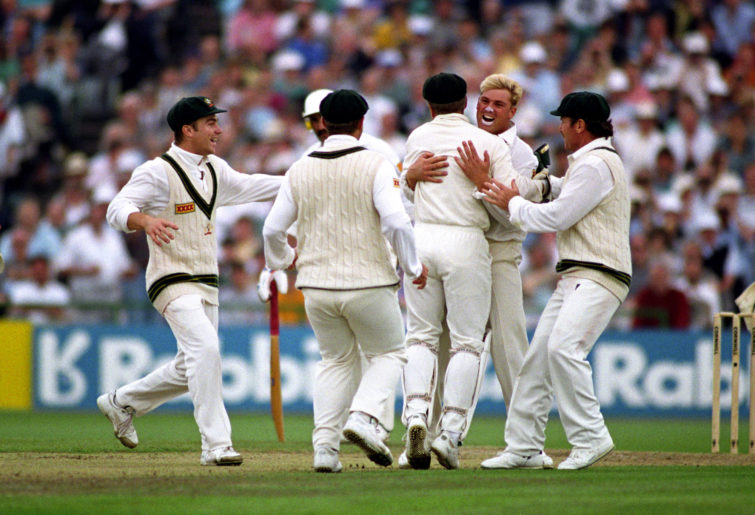
Even strong sides can sometimes be underwhelming due to injuries or player availability. For example, in the 2000s, India drew a series in Australia against the all-conquering Steve Waugh side, on the surface a brilliant achievement. However, dig deeper and we find both Glenn McGrath and Shane Warne sitting out the entire series. Ian Botham’s early lofty reputation was in part earned by beating up inferior Australian opposition during the World Series Cricket era.

(Photo by Adrian Murrell/Allsport/Getty Images/Hulton Archive)
The only way to really judge opposition strength is to look at the relative combined career-to-date averages of the opposition in every single Test match and then to consider all the arguments that basic career averages bring up. I may be crazy but I don’t have that kind of time on my hands. Others have gone there however, and good luck to them.
Similarly, how do we decide when a pitch is flat? David Warner is often described as a flat track bully or a home track bully, but he could be better described as a bouncing track bully, as his record on the generally spicy pitches of South Africa is also very decent.
We often see a track that is flat as a pancake for a home side batting first become a tricky proposition once the visiting side arrives at the crease. Does flat track equal home track? I’d say opening batsmen in England and New Zealand would disagree.
The flat track bully argument is often used to discount the achievements of players such as Muttiah Muralitharan and Kumar Sangakkara, who had generous stats against Zimbabwe and Bangladesh. This approach is used on Murali in particular to try and reduce his amazing career to stealing candy from babies and elevate the other great spinner of the era, Shane Warne.
Murali’s record in Australia (just 12 wickets at 75.4) is often cited as justification for this weak-team bully accusation, however he averaged under 30 in every other nation apart from India. Oddly enough, both the great spinners were equally ineffective in India, averaging over 43 each. Those 1990s to 2000s Indians were good players of spin.
(Photo by Rui Vieira/EMPICS via Getty Images)
Let’s have a look at how some great players’ records are affected by their records against Bangladesh and Zimbabwe, generally accepted as the weakest teams in Test cricket. Bangladesh currently has an historical winning percentage of 11.4 per cent, just trailing Zimbabwe on 11.5 per cent. The next lowest is New Zealand’s 23.5 per cent.
This New Zealand number is influenced by going a record 44 Tests without a win between 1930 and 1956. Just to stick the boot in, they went another 23 without victory between 1963 and 1968.
So should Tests against the Kiwis in those era be discounted? What about the West Indies? Their historical record against South Africa between 1992 and 2015 is three wins from 28 Tests. Should South Africans have their achievements against the West Indies in this era expunged from their records?
Ireland and Afghanistan are also going to potentially pad some opposition figures, although that would require countries like Australia to actually agree to play them. Fingers crossed for November.
The tables below shows a selection of players, their overall record, their minnows record against Bangladesh and Zimbabwe, and how they look with performances against those countries removed. Let’s start with the batsmen.
Batsmen
| Player | Runs | Average | Minnow runs (percentage of total) | Minnow average | Adjusted runs | Adjusted average |
|---|---|---|---|---|---|---|
| Steve Smith | 7540 | 61.80 | 0 | 0 | 7540 | 61.80 |
| Jacques Kallis | 13,289 | 55.37 | 996 (7.5 per cent) | 124.50 | 12,293 | 52.99 |
| Kumar Sangakkara | 12,400 | 57.40 | 2352 (19.0 per cent) | 94.08 | 10,048 | 52.61 |
| Brian Lara | 11,953 | 52.88 | 395 (3.3 per cent) | 65.83 | 11,558 | 52.53 |
| Ricky Ponting | 13,378 | 51.85 | 550 (4.1 per cent) | 78.57 | 12,828 | 51.11 |
| Sachin Tendulkar | 15,921 | 53.78 | 1738 (10.9 per cent) | 96.55 | 14,183 | 51.02 |
| Kane Williamson | 7115 | 54.31 | 1076 (15.1 per cent) | 97.81 | 6039 | 50.33 |
| Rahul Dravid | 13,288 | 52.31 | 1539 (11.6 per cent) | 85.50 | 11,749 | 49.78 |
| Steve Waugh | 10,927 | 51.06 | 546 (5.0 per cent) | 273 | 10,381 | 48.97 |
Steve Smith is the big winner here, having played exactly zero times against either Bangladesh or Zimbabwe. His healthy lead over the other great batsmen of the past 30 years is extended further.
The relentlessly professional Jacques Kallis made sure he put the minnows to the sword when he had the chance, averaging 124 with the bat and 14 with the ball. This inflated his overall batting average above his peers of the time.
Kumar Sangakkara has scored more runs against Bangladesh and Zimbabwe than any other player in history. His average drops a whopping five points when the minnows are removed, leaving him with a still brilliant record, but much more in line with Kallis, Lara, Ponting and Tendulkar, rather than a few points above them.
Lara and Ponting both had minimal opportunities against minnows so their records stand, whereas removing Sachin Tendulkar’s 1738 runs at 96 places his adjusted career average just behind his great rivals.
Others to have taken advantage of some soft runs include Rahul Dravid, Kane Williamson and especially Steve Waugh, who had a reputation of never giving a sucker an even chance.
I should also point out that there are only three players to average over 200 against the minnows. Steve Waugh is one, Vinod Kambli scored 227 in his only innings, and then there is Jason Gillespie. The man with the best mullet in the business averaged 247 from four innings against Bangladesh. Matthew Hayden’s 380 in Perth against Zimbabwe maybe robbed Dizzy of the chance to add another double century to his resume!
Bowlers
| Player | Wickets | Average | Minnow wickets (percentage of total) | Minnow average | Adjusted wickets | Adjusted average |
|---|---|---|---|---|---|---|
| Muttiah Muralitharan | 800 | 22.72 | 176 (22.0 per cent) | 15.09 | 624 | 24.9 |
| Shane Warne | 708 | 25.41 | 17 (2.4 per cent) | 25.7 | 691 | 25.4 |
| Rangana Herath | 433 | 28.07 | 80 (18.5 per cent) | 22.17 | 353 | 29.4 |
| Daniel Vettori | 362 | 34.36 | 83 (22.9 per cent) | 20.38 | 279 | 38.5 |
| Jacques Kallis | 292 | 32.65 | 38 (13.0 per cent) | 14.42 | 254 | 35.4 |
| Shane Bond | 87 | 22.09 | 24 (27.6 per cent) | 11.25 | 63 | 26.2 |
| Waqar Younis | 373 | 23.56 | 80 (21.4 per cent) | 17.67 | 293 | 25.2 |
| Dale Steyn | 439 | 22.95 | 36 (8.2 per cent) | 15.83 | 403 | 23.6 |
| Glenn McGrath | 563 | 21.64 | 11 (2.0 per cent) | 19.45 | 552 | 21.7 |
Okay, so Warne versus Muralitharan. The great Sri Lankan took more minnow wickets than any other player, a whopping 176 at a bowling average of just 15. In contrast Shane Warne took just two per cent of his wickets against Zimbabwe and Bangladesh.
When these numbers are removed, the records of the two great spinners are brought much closer together, with Warne taking 66 more top level wickets and their averages finish only 0.6 apart. Although not providing a definitive answer, by looking at their records in this way, the apparent statistical advantage held by Muralitharan drains away.
Daniel Vettori took over 20 per cent of his wickets against minnows and without that record his statistics are very ordinary. Rangana Herath is another who took plenty of cheap wickets, but his overall record still stands up pretty well.
Pace bowlers have not tended to feast as much on the lesser teams, but I’ve highlighted a few who had some days out. Injury-prone New Zealander Shane Bond took nearly 30 per cent of his wickets against Bangladesh and Zimbabwe at a bowling average of just over 11, elevating his career record from good to great.
Others took wickets at low averages, but their career numbers still stack up. Like Warne, Glenn McGrath had almost no opportunity to fill his boots, although he regularly padded his record with hapless West Indians and Englishmen.
This entire analysis would be turned on its head if we added, say, the post-2000 West Indies to the minnows. Since 2000, Jimmy Anderson has taken 87 wickets at 22. His career average of over 26 would likely jump over 28. Dale Steyn and Chaminder Vaas both took their Caribbean wickets at under 20.
On the batting side, Jacques Kallis has scored over 1800 runs at an average around 75 against the post-2000 West Indies. Steve Smith averages a cool 165 but only for 500 runs, while Adam Voges’ average of 542 stands alone.
The idea of the flat track bully, whether due to pitches, weak opposition or home town comforts, is a seductive one. It allows career figures to be sliced to pieces to produce a fairer result. The only problem is who gets to decide what’s fair.
Build your own fantasy cricket team and put it to the test with Draftstars daily fantasy competitions. Pick your match, pick your team and watch the points roll in to take out cash prizes on each match. What are you really gambling with? Set a deposit limit.