


- Video
-
Club Roar
Captured a great grassroots sporting moment? We want to see it!Content Collections
The Roar Community
- Join
- Login
Opinion
We often hear the Australian pace bowling attack characterised as the ‘Big Three’ and they each have certainly had their fair share of moments over the past decade.
But who is the best and what are their strengths and weaknesses? And how do they compare to our other recent pace bowling options?
Pat Cummins made his debut in November 2011 (followed by a six-year injury hiatus), and Mitchell Starc just one month later. Josh Hazlewood had to wait until December 2014 to join the club.
Since the debut of Cummins, nine Australian pace bowlers have taken at least 20 wickets (I have excluded all-rounders Shane Watson and Mitchell Marsh). Their basic records since November 2011 are as follows:
| Name | Matches | Wickets | Average | Strike rate | Wickets per test |
|---|---|---|---|---|---|
| Mitchell Starc | 62 | 257 | 27.5 | 49.2 | 4.1 |
| Josh Hazlewood | 56 | 214 | 25.6 | 55.9 | 3.8 |
| Pat Cummins | 35 | 169 | 21.2 | 46.2 | 4.8 |
| Peter Siddle | 44 | 143 | 30.1 | 63.2 | 3.3 |
| Mitchell Johnson | 28 | 126 | 25.4 | 45.2 | 4.5 |
| Ryan Harris | 20 | 82 | 24.5 | 53.8 | 4.1 |
| James Pattinson | 21 | 81 | 26.3 | 48.9 | 3.9 |
| Ben Hilfenhaus | 10 | 44 | 20.8 | 52.1 | 4.4 |
| Jackson Bird | 9 | 34 | 30.6 | 56.8 | 3.8 |
Pat Cummins is a golden god. Top two in average, strike rate and wickets per Test. In each of those categories he is in the very top echelon in history. It also means that he takes regular wickets, while keeping the runs down and can do it all day. Golden. God.
Good Mitch was terrifying. This time period was basically the second coming of Mitch, incorporating his 2013-14 hatchet job on the English. In four series between November 2013 and June 2015, Johnson took 86 wickets in just 14 Tests.
Ben Hilfenhaus has a tidy back-end to his Australian career. After a year off, Hilf played a superb home series against India (27 wickets in four Tests at 17.2), then away to West Indies (ten wickets at 20.8), before fizzling out back at home with a couple of Tests against South Africa and Sri Lanka.
Pattinson and Starc have career figures which are basically carbon copies.
Winning Test matches
Let’s have a look at the Big Three and how much influence they have in actually winning Test matches.
Mitchell Starc: 32 wins (54.4 per cent of all matches), 22 losses and seven draws. Wins average 23.2 (peer difference: 0.0 per cent). Wins wickets per match 4.6.
Pat Cummins: 18 wins (53 per cent of all matches), 11 losses and five draws. Wins average 19.3 (peer difference: +18 per cent). Wins wickets per match 4.9.
Josh Hazlewood: 26 wins (47 per cent of all matches), 20 losses and nine draws. Wins average 20.3 (peer difference: +19 per cent). Wins wickets per match 4.8.
Peer difference is how each player performed in matches won compared to the other bowlers in those same matches.
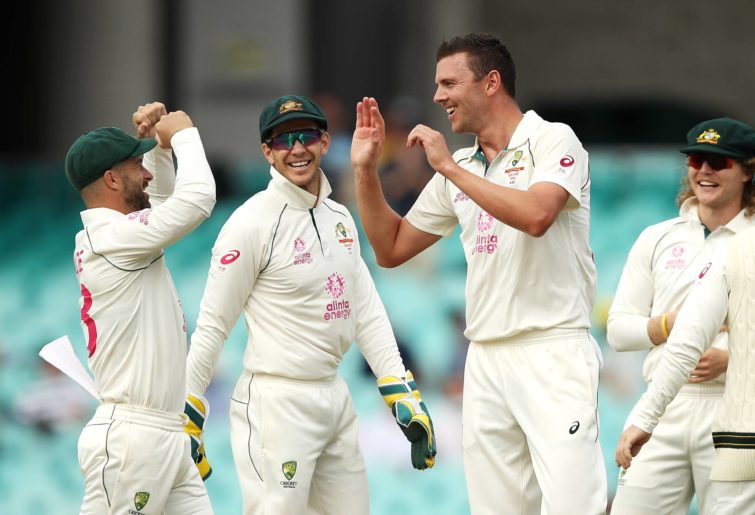
(Photo by Mark Kolbe – CA/Cricket Australia via Getty Images)
These are very similar figures across our Big Three. Cummins shades Hazlewood for bowling average, but Hazlewood is slightly better compared to his peers in his wins. Cummins also takes the wickets per match mark, but it’s not much different for all three.
The noticeable difference is that in wins involving Starc, he performs no better and no worse than his fellow bowlers in those matches.
But for Starc, it’s all about the strike rate. 43.0 is around 2.5 balls better than Cummins and Hazlewood. This mark is just behind Mitchell Johnson but better than noted destroyer Jeff Thomson. On raw strike rate, Starc sits fourth of all time for strike rate in wins behind George Giffen, Dennis Lille and Johnson.
Cummins has only played in five draws but his bowling average of 27 and 3.8 wickets per Test is miles ahead of his two bowling partners. This indicates the new captain is able to find a way on unresponsive decks, which would match my gut feel. Starc brings up the rear, with only 2.6 wickets per Test and an average of 49.
Hazlewood’s bowling average is 44 with 2.2 wickets per Test.
All of the Big Three are great in losses. Starc and Hazlewood are almost identical and rank seventh and eighth respectively all-time for bowling average in losses (minimum ten losses).
In terms of peer difference percentage, Starc has the third highest for bowling average in losses and Hazlewood has the third highest for economy rate. So, we are well served in losses by these two great pace bowlers.
And then there is Cummins. He has only lost 11 times, but his numbers are remarkable. His raw bowling average of 23.2 is third all-time for Australia, behind 19th century bowler Charles ‘Terror’ Turner and 1978 Ashes star Rodney Hogg, and ahead of Glenn McGrath. His average in losses is a ridiculous 39 per cent better than his peers, who, remember, are also very good indeed.
The only bowler to better his 5.2 wickets in losses is Turner, who had hung up his boots by 1895. And literally no one, even from a century ago, matches his strike rate in losses of 46.5. This is very close to his strike rate in wins and is the best of all time (minimum ten matches).
Pat Cummins doesn’t admit defeat. He doesn’t even taper off in draws. Not a bad trait for our newest Test captain.
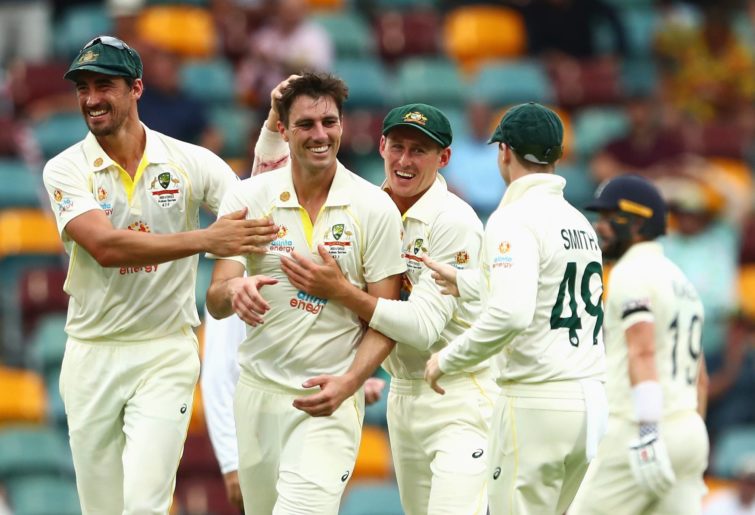
Pat Cummins celebrates getting five wickets in the first Test. (Photo by Chris Hyde/Getty Images)
So, for me it’s Pat Cummins as the first among equals. But we are truly blessed right now.
Let’s compare to our last ‘great’ bowler.
Mitchell Johnson: 39 wins (53.4 per cent of all matches), 22 losses and 12 draws. Wins average 21.72 (peer difference: +12.9 per cent). Wins wickets per match 5.08. (Note, this is Johnson’s whole career, not just since November 2011).
These are seriously good numbers for Johnson. More than five wickets per Test is very good, in fact the tenth best of all-time. An average under 22 as a fast bowler is excellent. A strike rate of 42.2 is truly elite. Only 19th century bowler George Giffen and Australia’s greatest fast bowler Dennis Lillee do better. It is 17 per cent better than his fellow bowlers in those wins.
So, when Mitch was good, he was very, very good. Anyone who saw the 2013-14 Ashes knows this. But the allegation is also that when he was bad, he was awful.
Let’s see.
In losses, Johnson averaged 40.7, however, this was 8.7 per cent better than his peers and his strike rate of 67.5 was good. The problem was his economy rate of 3.61 (“He bowls it to the left,” etc).
In draws, Johnson had a nearly 15 per cent better bowling average than his peers. His strike rate was nearly 29 per cent better and is the fifth best of all-time in draws. His 3.75 wickets per Test ranks sixth. Again with the performances in draws by express bowlers!
So, Mitch was a strike bowler in all circumstances and when he got it right he was unstoppable.
Home and away
How do our Big Three perform home and away?
| Name | Home record (wickets / bowling average) | Away record (wickets / bowling average) |
|---|---|---|
| Mitchell Starc | 163 at 26.8 | 88 at 27.0 |
| Pat Cummins | 97 at 20.7 | 72 at 21.9 |
| Josh Hazlewood | 129 at 24.7 | 85 at 27.0 |
| Mitchell Johnson | 171 at 25.5 | 133 at 31.1 |
What this tells us is that there is very little difference between performance home and away across all of the Big Three. Hazlewood has the biggest difference, but it’s not significant and an average of 27 is just fine.
Once again, Cummins is in another stratosphere. That away record is only just behind all-time greats Glenn McGrath, Alan Davidson and Bill O’Reilly. No other bowler has taken more than 50 wickets at a better away bowling average.
The generally accept graveyard for fast bowlers is in Asia. If we restrict away Tests to Asia, then Cummins’ average balloons out to 29.7, which is still pretty acceptable. Starc shades Cummins here with an average of 27.9, while Hazlewood is not suited to the conditions, averaging 35.4.
Some other random facts below.
Pat Cummins
•Has averaged under 20.2 in each of the last four years
•Improves his average when his team loses the toss (19.0)
•Is better in the second innings (18.1)
•Averages 16.2 in day-night matches, compared to 19.9 for Hazlewood and 18.9 for Starc.
Mitch Starc
•Has averaged over 26.4 only twice in the last eight years
•Records progressively worse figures the longer a series goes: first Test = 24 average, second Test = 25, third Test = 32, fourth Test = 37, fifth Test = 53.
The takeaway from all of this is that despite a lot of negative reaction after their collective failure to defeat India last summer, each of the Big Three would be a worthy attack leader in almost any other team and in almost any situation or conditions. And we have three of them.
But our greatest blessing is that we have Patrick Cummins.
Build your own fantasy cricket team and put it to the test with Draftstars daily fantasy competitions. Pick your match, pick your team and watch the points roll in to take out cash prizes on each match. What are you really gambling with? Set a deposit limit.