'Big achievement': Jason Gillespie secures major appointment as Pakistan Test coach
Australian fast bowling great Jason Gillespie has been named head coach of Pakistan's Test team, as the nation overhauls its coaching department ahead of…

In the wake of Australia’s World Cup win, Mohammed Kaif and others suggested that India still had the best team on paper, evoking fond memories of Stuart Broad’s claim that England took the Ashes with a moral victory.
I usually don’t pay too much attention to ODI stats, particularly as so many meaningless games have been played, with lots of players getting rested, a growing trend since T20 internationals have crowded the fixture list. Nevertheless, I thought the hiatus before the Test season brings a chance to delve into some fantasy cricket and look at who have been the best players on paper.
How to measure the best 50-over cricketers over the decades? Whose overall ODI record is better – Virat Kohli averaging 58 at 93 runs/100 balls, or AB de Villiers averaging 54 at 100?
Batting and Bowling Impact
ABC cricket statistician Ric Finlay has devised a metric that combines both batting and bowling averages on the one hand, and scoring rates or economy rates on the other. “Batting Impact”(BtI) is the geometric mean of a player’s average and career scoring rate – that is, the square root of [batting average multiplied by scoring rate]. “Bowling Impact” is measured in a similar way, and the same method can be applied to T20s.
This means that a player averaging 40 at a scoring rate of 90 (similar to Andrew Symonds) has the same Batting Impact as someone averaging 30 at 120 (close to Glenn Maxwell) or 45 at 80 (a bit above Kane Williamson). All would earn a BtI of 60, the square root of 3,600.
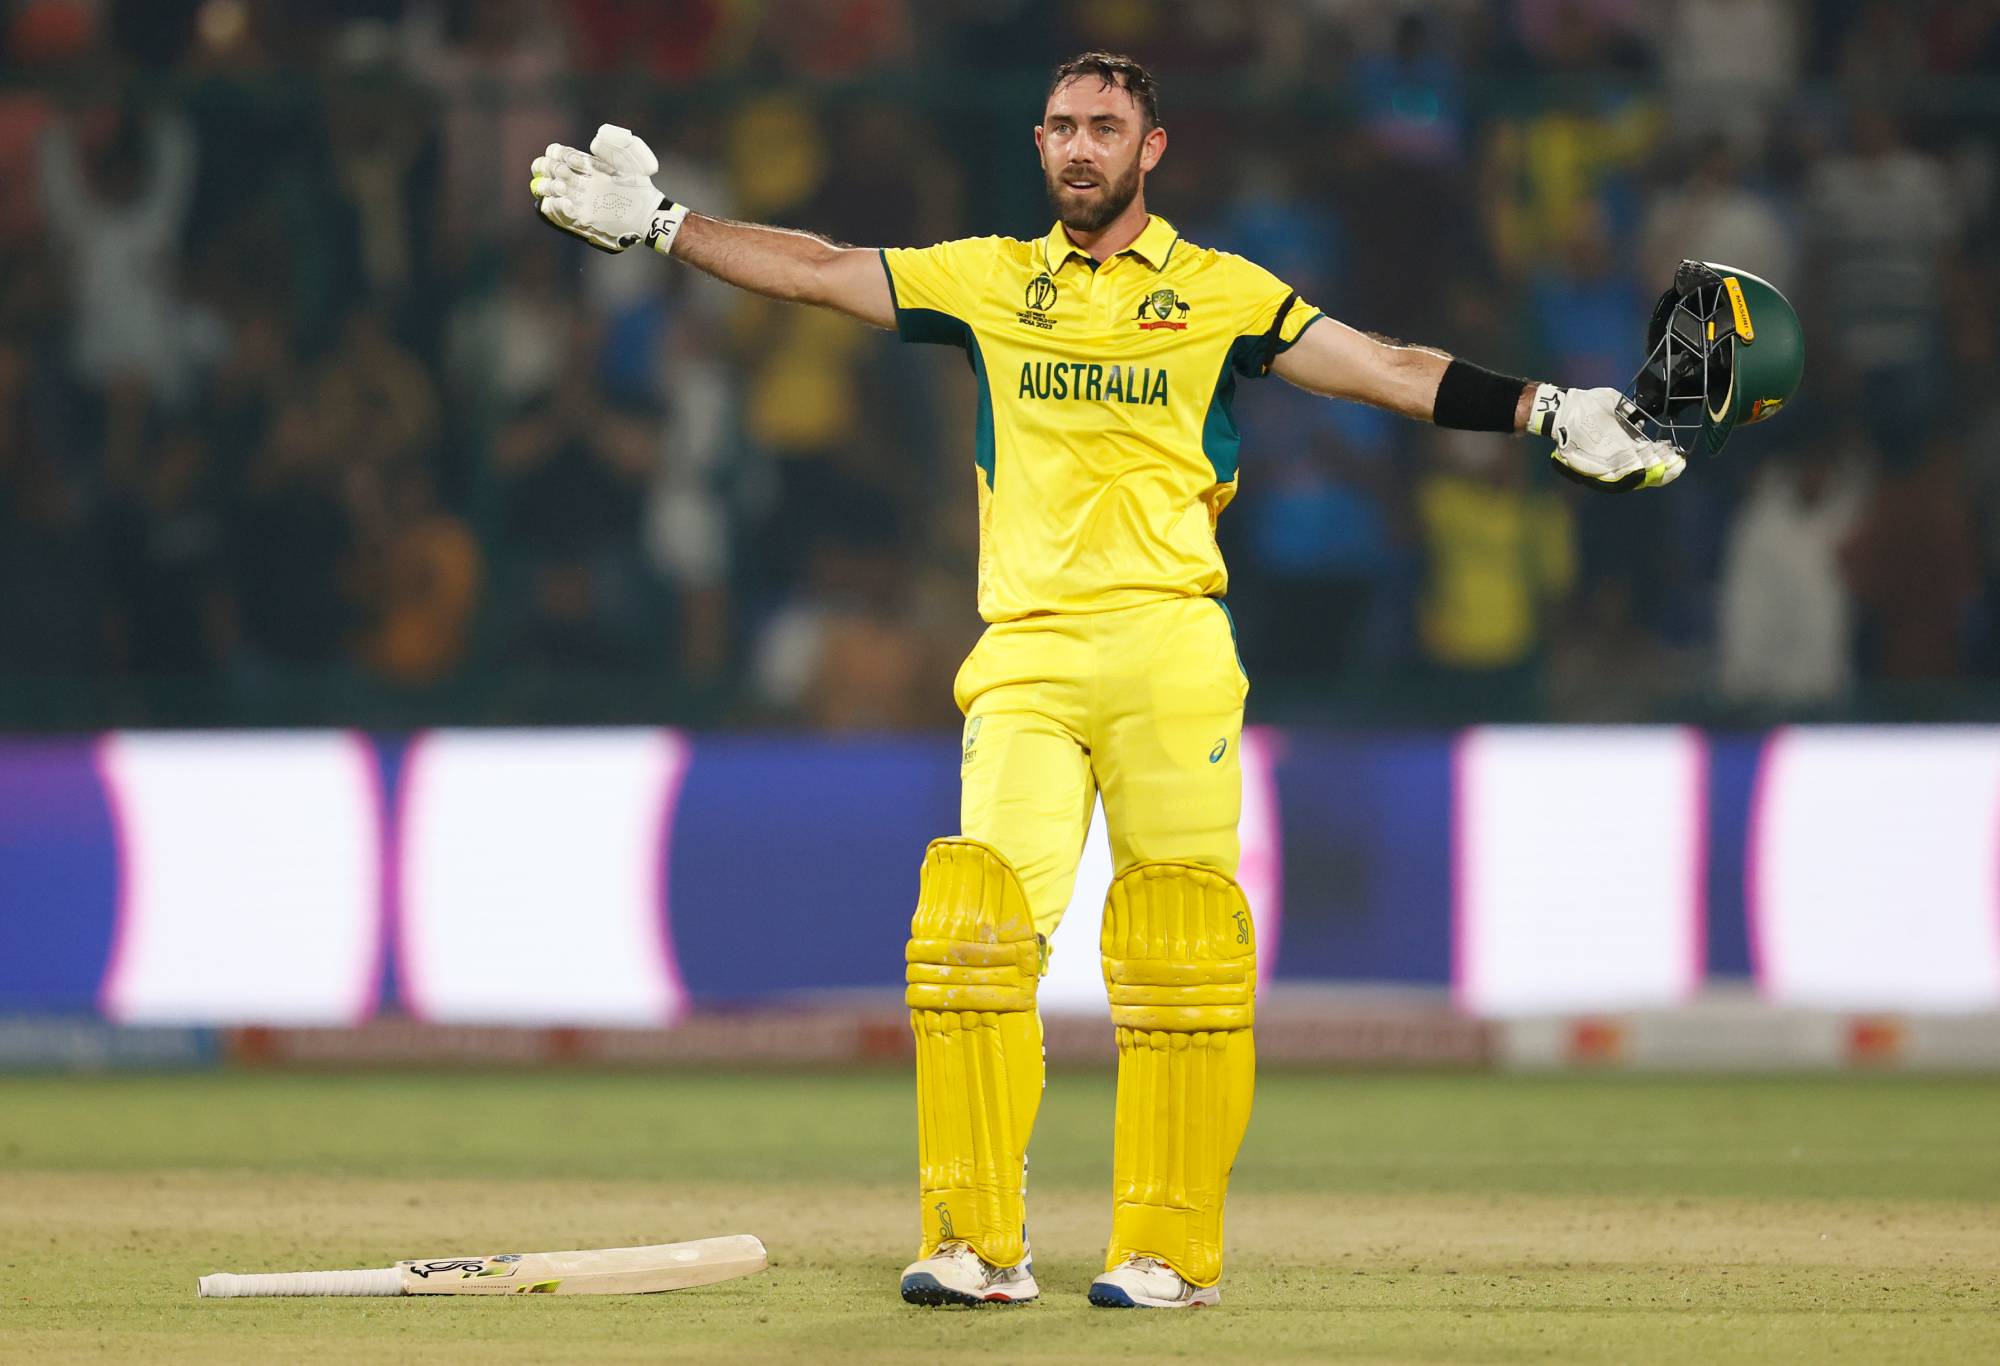
Glenn Maxwell of Australia celebrates their century during the ICC Men’s Cricket World Cup India 2023 between Australia and Netherlands at Arun Jaitley Stadium on October 25, 2023 in Delhi, India. (Photo by Darrian Traynor-ICC/ICC via Getty Images)
I don’t have the expertise to debate the pros and cons of this formula in detail, but it has gained a stamp of approval from Finlay’s fellow cricket statisticians after he showed them some modelling. It instinctively seems to do a good job of weighting both factors. It is hard to regularly score very quickly with a very low average: only West Indies’ Andre Russell – average 27 – has scored faster than Maxwell over a sustained period. Likewise if you scored really slowly – say at 60/100 – while averaging 60 or more, you would make it harder for your team to amass a big score and would probably get dropped.
Adjusting for Era
The other key question in comparing players from different eras is that, unlike Test cricket, ODI batting and bowling stats have changed in a big way since the first one-dayer in 1971, for three main reasons:
To illustrate, if we divide the history of ODI cricket into four periods, the average runs per wicket and the average scoring rates have gone up a lot:
| ODIs – Batting Impact adjusted for Era * | ||||||||
| Rank | Player | Span | Matches | Average | Average Era Adjusted | Scoring Rate | S/R Era Adjusted | Batting Impact |
| *Matches among 9 major nations only: Aus, Ban, Eng, Ind, NZ, Pak, SA, SL, WI | ||||||||
| 1 | Viv Richards (WI) | 1975-1991 | 185 | 47.2 | 50.8 | 90.1 | 99.3 | 71.0 |
| 2 | Zaheer Abbas (PAK) | 1974-1985 | 61 | 47.8 | 52.2 | 85.0 | 95.4 | 70.6 |
| 3 | AB de Villiers (SA) | 2005-2018 | 205 | 54.4 | 53.0 | 100.0 | 92.3 | 70.0 |
| 4 | Virat Kohli (IND) | 2008-2023 | 273 | 58.6 | 55.9 | 93.8 | 83.5 | 68.3 |
| 5 | Michael Bevan (AUS) | 1994-2004 | 208 | 53.8 | 55.6 | 73.7 | 75.3 | 64.7 |
| 6 | Mike Hussey (AUS) | 2004-2012 | 178 | 49.0 | 49.2 | 86.9 | 83.1 | 63.9 |
| 7 | Clive Lloyd (WI) | 1973-1985 | 85 | 39.5 | 43.3 | 81.2 | 91.3 | 62.9 |
| 8 | MS Dhoni (IND) | 2004-2019 | 334 | 49.9 | 48.4 | 87.4 | 80.5 | 62.4 |
| 9 | Greg Chappell (AUS) | 1971-1983 | 74 | 40.2 | 44.5 | 75.7 | 86.0 | 61.9 |
| 10 | Rohit Sharma (IND) | 2007-2023 | 243 | 48.7 | 46.6 | 91.8 | 82.1 | 61.9 |
| 11 | Sachin Tendulkar (IND) | 1989-2012 | 411 | 43.2 | 44.3 | 85.2 | 85.8 | 61.6 |
| 12 | Andrew Symonds (AUS) | 1998-2009 | 180 | 40.0 | 40.8 | 92.8 | 91.9 | 61.3 |
| 13 | Matthew Hayden (AUS) | 1993-2008 | 145 | 44.1 | 45.8 | 78.5 | 81.9 | 61.2 |
| 14 | Dean Jones (AUS) | 1984-1994 | 161 | 44.4 | 47.0 | 72.5 | 78.8 | 60.9 |
| 15 | Babar Azam (PAK) | 2015-2023 | 95 | 54.0 | 49.3 | 88.6 | 75.0 | 60.8 |
That is, batting averages have increased by about 15 percent and scoring rates by 25 percent since the 1970s and 80s. The average completed total has risen from under 220 in the early 1980s to about 270 since 2011.
Therefore, in calculating batting and bowling impact for top ODI players, I have adjusted the numbers to take account of these changes over time. I do this by finding the percentage difference between the numbers for the period in which the batter or bowler played and the median of the four eras above. I then and add or subtract or add that percentage from/to their average, scoring or bowling economy rate.
For example, Virat Kohli’s average of 58 is reduced by 5 percent to 55.7, which is the percentage. difference between average runs per wicket in the period since he debuted in 2008 (32.15) and the median average per wicket over the entire history of ODIs (30.74). His scoring rate is reduced 11 percent from 93.8 to 83.5. Batters from earlier eras like Viv Richards and Greg Chappell see their figures boosted a few notches.
Best Ever rankings
So here is my list of the leading ODI batters, measured by era-adjusted Batting Impact. I made a minimum qualification of 50 ODIs and a career of seven years to ensure a decent spread of opponents and conditions for each player. I have also confined the figures to matches between the nine countries that have ranked as serious Test teams over extended periods (see note to table): official ODI stats have become degraded by the inclusion of ODIs between all sorts of associate members.
For example, sitting on top of the all-time ODI batting averages with 67 is Ryan ten Doeschate of the Netherlands, who played only 8 of his 33 ODIs against tier one teams as opposed to minnows like Scotland, Bermuda, Ireland and Kenya. This also means Maxwell’s amazing centuries against Afghanistan and the Netherlands aren’t included. That might seem a bit unfair in the case of Afghanistan, but it would be inconsistent and time consuming to do otherwise.
| Averages and Scoring Rates in ODIs over time | |||
| Era | Average | Runs per over | Average complete innings |
| 1971-1990 | 28.4 | 4.3 | 217 |
| 1991-2000 | 29.4 | 4.6 | 230 |
| 2001-2010 | 30.3 | 5.0 | 248 |
| 2011-2023 | 32.5 | 5.4 | 272 |
The top four – Richards, Zaheer, De Villiers and Kohli – stand out as a cut above the rest. The ranking confirms my suspicion that Viv Richards’s record in the 70s and 80s is as good or better than Virat Kohli’s when adjusted for era. De Villiers just edging out Kohli isn’t such a surprise when you consider his fast scoring.
Pakistan’s Zaheer Abbas may be unfamiliar to some, but his average and strike rate stand out in the first decade of ODIs, only just behind Richards. Zaheer was a bit of a home track bully: his 59 batting average at home was 20 points higher than his away average – almost exactly the opposite of both Richards and Greg Chappell. But even if we doubled the weighting for home games, he’d still come third, between ABdV and Kohli. And he averaged 50 across 14 World Cup matches.
Greg Chappell’s presence in the top ten is a bit of a surprise as he was more renowned as a Test batsman and his ODI career best known for ordering his brother Trevor to bowl the final ball underarm against the Kiwis in 1981. West Indian great Clive Lloyd won fame for his 102 off 82 balls to help win the first World Cup final against Australia in 1975. While that was his only century in 87 ODIs, he did average 44 @ 85 in 11 World Cup innings.
The next fifteen batters making up the top 30 sit within such a narrow band on the Batting Impact scores – between Klusener at 60.7 and Root on 57.7 – that it’s hard to claim these are significant differences. They are in order:
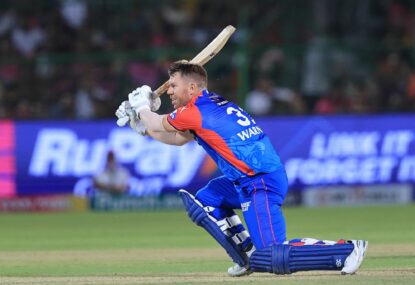
16. Lance Klusener 17. Shreyas Iyer 18. Jos Buttler 19. Hashim Amla 20. Quinton de Kock 21. Virender Sehwag 22. Adam Gilchrist 23. David Warner 24. Faf du Plessis 25. Jonny Bairstow 26. David Miller 27. Ricky Ponting 28. Gordon Greenidge 29. Ross Taylor 30. Joe Root.
Many will be surprised that Tendulkar doesn’t rank in the top ten. It’s partly because eliminating games against minnows lowers his average and scoring rate a couple of points. Tendulkar made ten of his 59 ODI centuries against minnows – Zimbabwe, Kenya and Namibia.
Maxwell’s amazing strike rate of 121 against the better nations, which comes down to 105 after adjusting for era, helps put him at 37th with a Batting Impact of 56.6, fractionally behind Travis Head, Ben Stokes and Michael Clarke and just ahead of Steve Smith, Kumar Sangakkara and Kane Williamson.
If we removed the minimum qualification of seven years and 50 matches against top tier sides, some current players would feature near the top of the table: Shubman Gill (39 matches since 2019) would rank fifth, Heinrich Klaasen (43 matches since 2018) would be inserted at sixth, and Rassie van der Dussen (2019-) ninth ahead of Lloyd and Dhoni. That would give the current Indian team the batters ranked 4, 5, 13, 20th and 39th (KL Rahul) all time. If we leave out Klaasen and co, Australia’s World Cup winners are placed 23 (Warner), 33 (Head), 37 (Maxwell), 41 (Smith) and 48 (Marsh), with Marnus well out of the picture.
Conclusions
Rohit Sharma is the only opener in the top ten. In selecting a top six for an all-time team we might need to bring in another opener from outside the top ten, such as Tendulkar, or open with Kohli, e.g. a top order of Sharma, Kohli, Zaheer, Richards, de Villiers and Dhoni, assuming we need a keeper in the top 6. But maybe players with even higher adjusted scoring rates like Sehwag (102/100) or Gilchrist (97) should be considered at the top for the best mix, and maybe the likes of Lloyd (92) or Klusener (91) at no. 6.
Any thoughts on the method and the relevance to picking fantasy teams are most welcome. The only big answer for me was to support the idea that Viv Richards and AB de Villiers rank near the top. Quantity of runs and centuries shouldn’t trump quality, although it’s worth also looking of the performances of players like Kohli in steering their team to victory.
Another layer that could be explored is peak performance – focusing on a batter’s best ten consecutive years, for example, as those with very long careers can be disadvantaged. Richards would still comes out on top, as he had a significant downwards turn in his last few years. Sharma would jump up to 5th and Dhoni and Tendulkar to 7th and 8th if we only took their best ten years, while Tendulkar moves to 6th if we just count the 142 matches he opened the batting from 2001-11.
In a (hopefully briefer) Part 2, I’ll cover the Bowling Impact rankings, all-rounder ratings and look at a possible best-all-time Paper XI, and how the best World Cup sides compare. To which, some will say – “who cares, Australia won! Again!”
Build your own fantasy cricket team and put it to the test with Draftstars daily fantasy competitions. Pick your match, pick your team and watch the points roll in to take out cash prizes on each match. What are you really gambling with? Set a deposit limit.
Australian fast bowling great Jason Gillespie has been named head coach of Pakistan's Test team, as the nation overhauls its coaching department ahead of…
Will Jacks got RCB past the 200 target set by Gujarat with four overs to spare.
With Rajasthan needing 25 off 17, both batsmen ended up at the same end but the bowler dropped the throw from his teammate -…
A six-laden, 27-ball 84 from Jake Fraser-McGurk to continue his outrageous debut IPL!
Johnny Bairstow has hit his way back into form with a 45-ball century as he steered his side to a record-breaking win, easily chasing…

It seems franchise cricket has forgotten about the great battle between bat and ball. In fact, this season in the IPL there is no battle at all.