


- Video
-
Club Roar
Captured a great grassroots sporting moment? We want to see it!Content Collections
The Roar Community
- Join
- Login
It is very hard for me to write these words as a devoted Canberra Raiders supporter. However, the statistical truth is my calling: the stats show that the Roosters are just too good.
2019 NRL Grand Final
» Match report: Roosters go back-to-back
» Player ratings: Sydney Roosters
» Player ratings: Canberra Raiders
» WATCH: Video highlights
While the valiant Green Machine deserves their shot at glory, theirs is only a puncher’s chance.
This is the first time in the NRL era that the second placed side has met the fourth placed side in the grand final.
This is the ninth time that the second-placed side has featured in an NRL decider. Four times that has resulted in victory: Bulldogs 2004, Sea Eagles 2008, Sea Eagles 2011 and Storm 2012.
This will be the fifth time the fourth-placed side has made the decider. 75 per cent of the time they have triumphed: Storm 2009, Wests Tigers 2005 and Ricky Stuart’s Roosters in 2002.
That side was the only fourth-placed side to beat a grand final opponent that finished the home-and-away season higher on the ladder.
In the NRL era the higher paced side has won eleven of the 20 deciders. Since the current finals system was introduced in 2012, the lower placed grand finalist has won four of the seven encounters.
Notably, no fourth-placed side has won the decider since the McIntrye finals system ended in 2011. Further, only one fourth-placed side – the 2013 Sea Eagles – has made the decider since then. Perhaps ominously, they were beaten by the Roosters.
Regardless of the winner, this will be the 17th time in the NRL era that the premier will have gone through the finals series undefeated.
Head to head
This will be the 64th meeting of these two clubs going back to 1982. The Roosters have the advantage 35 to 28.
The last ten between the sides have been split five apiece, with the Roosters winning both games this season, and putting the biggest score on the Raiders of any side this year: 30.
The last time the Raiders worst score conceded in a season was only 30 points was in 1994.
This will be just the fifth final between these sides, with the Roosters having a 3-1 advantage. However, the last time they met in a finals game was in 2004 when Ricky Stuart was coaching the Chooks.
These two teams have never played each other at this venue before.
(Photo by Mark Metcalfe/Getty Images)
Finals records
This will be the Roosters’ 43rd finals match in the NRL era. The maximum number they could have played in is 80. So they have played in almost 54 per cent of every possible finals game they could have.
They have won 25 of the 41 NRL finals they have played (61 per cent). This will be the Roosters’ eighth grand final appearance in 22 seasons. They’ve won three of seven so far.
The grand final will be the Raiders 20th final in the NRL era. They have won seven and lost twelve. They have only played in 24 per cent of the possible finals matches they could have. This season is the first time they have won two finals games in a row since 1994.
Defence wins premierships
The two sides that have made it are the second and third best defensive sides of 2019.
The Storm averaged just 12.1 points conceded a game in 2019. The Roosters average 14.4 points conceded a game, the Raiders 15.1.
The stats are overwhelming that the best defensive side wins the premiership.
| NRL premiers’ defensive rankings | ||
|---|---|---|
| Year | Winning team | Season defensive ranking |
| 2018 | Roosters | First |
| 2017 | Storm | First |
| 2016 | Sharks | Third (beat best defence) |
| 2015 | Cowboys | Fifth (beat third best) |
| 2014 | Rabbitohs | First |
| 2013 | Roosters | First |
| 2012 | Storm | First |
| 2011 | Sea Eagles | Second (beat fifth best) |
| 2010 | Dragons | First |
| 2009 | Storm | Second |
| 2008 | Sea Eagles | Second (Beat best defence – C. Smith suspension) |
| 2007 | Storm | First |
| 2006 | Broncos | First |
| 2005 | Cowboys | Seventh (beat sixth best) |
| 2004 | Bulldogs | Third (beat best defence) |
| 2003 | Panthers | Seventh (beat second best) |
| 2002 | Roosters | First |
| 2001 | Knights | Seventh (beat best defence) |
| 2000 | Broncos | First |
| 1999 | Storm | Fifth (beat sixth best) |
| 1998 | Broncos | First |
In 52.4 per cent (11/21) of the NRL seasons so far the best defensive side for the year has won the decider. Three more times the higher ranked defensive side in the decider won.
So two-thirds of the time, being the best defensive side in the grand final has equated with winning the game.
However, on four occasions (2016, 2008, 2004, 2001) the best ranked defensive side was beaten in the decider. So there is a glimmer of hope for the Raiders.
Grand final experience
The Roosters have masses of NRL grand final experience. The Raiders have virtually none. Twelve of the Roosters 17 players for the 2018 decider are returning for this game.
| grand final experience | |
|---|---|
| Raiders | Roosters |
| Joseph Leilua – 2010 | Mitchell Aubusson – 2010, 2013, 2018 |
| Jared Waerea-Hargraves – 2010, 2013, 2018 | |
| Siosiua Taukeiaho – 2018 | |
| Boyd Cordner – 2013, 2018 | |
| Daniel Tupou – 2013, 2018 | |
| Luke Keary – 2014, 2018 | |
| Cooper Cronk – 2006, 2007, 2008, 2009, 2012, 2016, 2017, 2018 | |
| Victor Radley – 2018 | |
| Joseph Manu – 2018 | |
| Latrell Mitchell – 2018 | |
| James Tedesco – 2018 | |
| Isaac Liu – 2018 | |
| Zane Tetevano – 2018 | |
| Brett Morris – 2010 | |
| 1 game total | 28 games total |
| 0 wins total | 23 wins total |
Games played
As with grand final experience, there is a big gulf between the two sides in general experience.
| Experience | Roosters | NRL games | Rep games | Finals games | Raiders | NRL games | Rep games | Finals games |
|---|---|---|---|---|---|---|---|
| Tedesco | 138 | 18 | 5 | Nicoll-Klokstad | 32 | 2 | 2 |
| Tupou | 159 | 17 | 16 | Cotric | 69 | 1 | 2 |
| Mitchell | 95 | 6 | 6 | Croker | 256 | 0 | 8 |
| Manu | 69 | 5 | 5 | Leilua | 203 | 14 | 11 |
| Morris | 256 | 33 | 16 | Rapana | 117 | 13 | 5 |
| Keary | 133 | 2 | 11 | Wighton | 155 | 3 | 6 |
| Cronk | 371 | 60 | 37 | Sezer | 154 | 0 | 5 |
| Radley | 54 | 0 | 5 | Tapine | 99 | 9 | 5 |
| Aubusson | 289 | 0 | 21 | Bateman | 22 | 15 | 2 |
| Cordner | 168 | 22 | 14 | Whitehead | 100 | 18 | 5 |
| Waerea-Hargreaves | 218 | 29 | 16 | Soliola | 199 | 16 | 7 |
| Verills | 13 | 0 | 2 | Hodgson | 107 | 17 | 5 |
| Liu | 157 | 13 | 14 | Papalii | 196 | 28 | 7 |
| Crichton | 81 | 4 | 5 | Simonsson | 20 | 0 | 2 |
| Tetevano | 103 | 3 | 6 | Guler | 13 | 0 | 2 |
| Butcher | 39 | 0 | 2 | Horsburgh | 21 | 0 | 2 |
| Taukeiaho | 108 | 10 | 10 | Lui | 137 | 5 | 4 |
| Total | 2451 | 222 | 191 | Total | 1900 | 141 | 80 |
| Average | 144 | 13 | 11 | Average | 112 | 8 | 5 |
The Roosters boast 551 more games NRL experience among their 17, with an average of 32 extra games played per player.
There are 81 more representative games for the Roosters at an average of five more per player.
The Roosters also have played a cumulative 111 more finals games than their green opposition, with an average of six more a player.
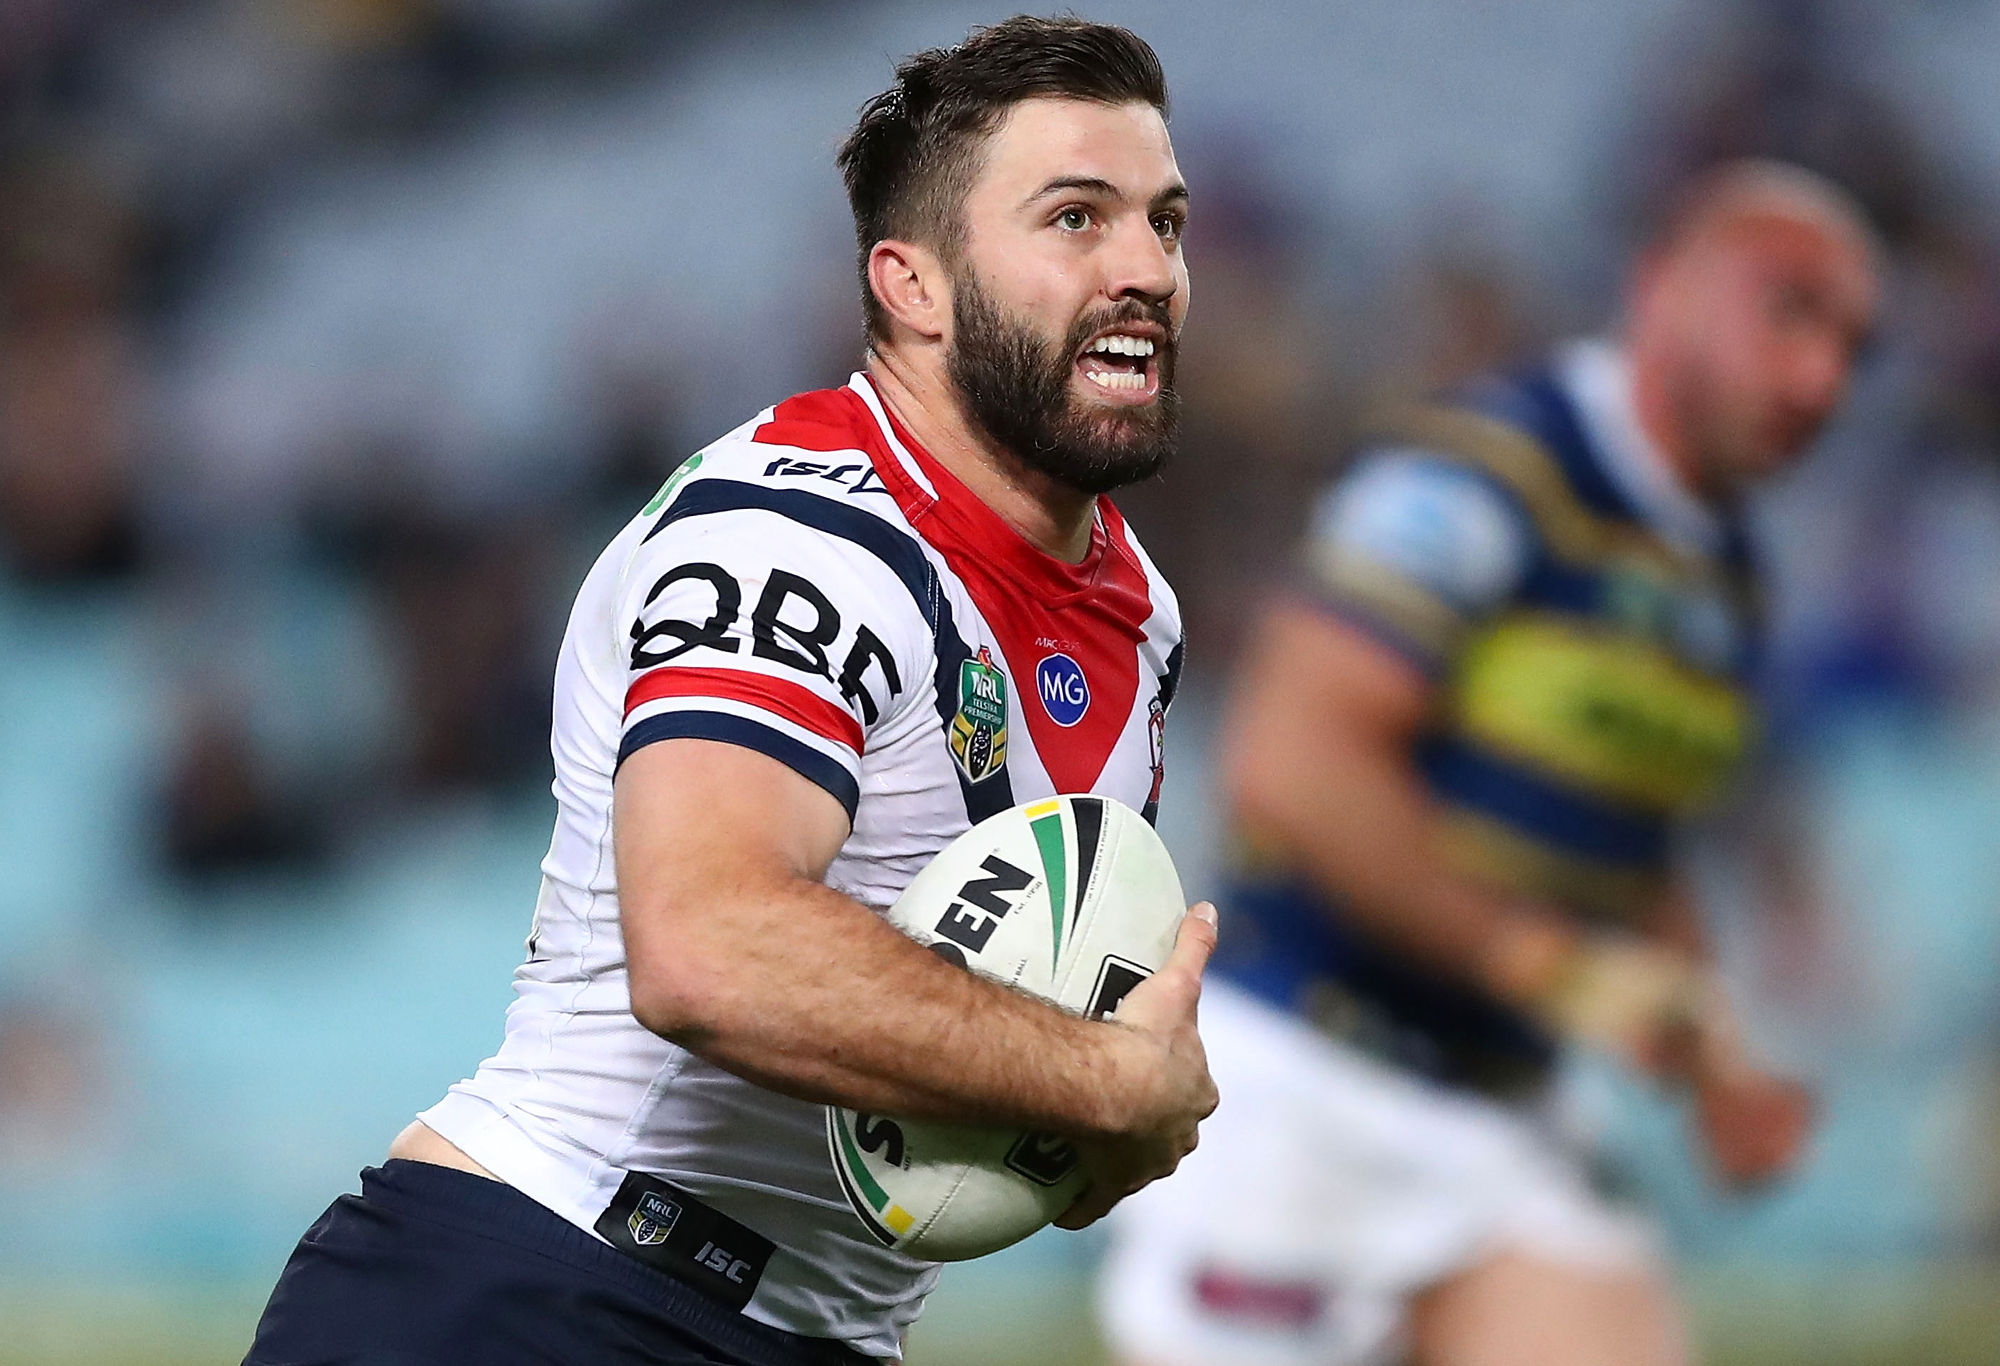
(Photo by Brendon Thorne/Getty Images)
Why the Roosters are going to win
All the stats above in regard to defensive precedence and experience are in the Roosters favour. To compound this, the Roosters are better than the Raiders in virtually every key team statistic.
When it comes to defence, the Roosters look pretty good.
| Defensive stats | |
|---|---|
| Penalties conceded | Roosters – 7 (#7 NRL |
| Raiders – 7.3 (#3 NRL) | |
| Tries Conceded | Roosters – 2.3 (#2 NRL) |
| Raiders – 2.6 (#3 NRL) | |
| Line breaks conceded | Roosters – 3.8 (#2 NRL) |
| Raiders – 3.8 (#3 NRL) | |
| Missed Tackles | Roosters – 23 (#2 NRL) |
| Raiders – 23.5 (#4 NRL) | |
While there isn’t much in these stats, they all favour the Roosters. However, when we get to the attack stats, the gulf between the two sides really opens.
| Offensive stats | |
|---|---|
| Tries | Roosters – 113 (#1 NRL) |
| Raiders – 93 (#6 NRL) | |
| Run Metres | Roosters – 1497 – (#1 NRL) |
| Raiders – 1429 – (#5 NRL) | |
| Line Breaks | Roosters – 5.6 – (#1 NRL) |
| Raiders – 4.3 (#8 NRL) | |
| Tackle Breaks | Roosters – 27.7 (#3 NRL) |
| Raiders – 25.7 – (#8 NRL) | |
| Kick Return Metres | Roosters – 118 (#1 NRL) |
| Raiders – 96 (#8 NRL) | |
These team stats show that, while the Raiders defence is almost as good as that of the Roosters, their attack is well off the pace set by the Bondi Boys.
And that really comes home to roost when you look at the leading individual stats for each team.
| Offensive stats – individual | |
|---|---|
| Tries scored | Mitchell – 19 (#2 NRL) |
| Tedesco – 17 (#3 NRL) | |
| Tupou – 15 (#8 NRL) | |
| Croker – 13 (#11 NRL) | |
| Try Assists | Keary – 28 (#2 NRL) |
| Hodgson – 16 (#16 NRL) | |
| Cronk – 15 (#19 NRL) | |
| Tedesco – 15 (#19 NRL) | |
| Line break assists | Keary – 29 (#1 NRL) |
| Tedesco – 18 (#11 NRL) | |
| Hodgson – 15 (#22 NRL) | |
| Tackle breaks | Tedesco – 134 – (#1 NRL) |
| Nicoll-Klokstad – 77 (#13 NRL) | |
| Line breaks | Tedesco – 29 (#1 NRL) |
| Croker – 17 (#9 NRL) | |
| Mitchell – 16 (#11 NRL) | |
| Run metres | Tedesco – 187 (#1 NRL) |
| Nicoll-Klokstad – 160 (#10 NRL) | |
| Tupou – 159 (#12 NRL) | |
| Papalii – 138 (#24 NRL) | |
| Taukeiaho – 128 (#34 NRL) | |
While Luke Keary may be the most statistically dangerous playmaker on the field, there is no question that James Tedesco is the superstar. He’s won everything he can win this year.
With these stats the odds are very good that he’ll add a Clive Churchill medal and premiership ring to complete the Tedesco slam. If the Raiders can’t limit the boy from Camden they will cop a flogging.
(Photo by Mark Metcalfe/Getty Images)
Things for Raiders fans to cling to
I can’t make it all doom and gloom for the Green Machine. There are some things to bring them some hope:
The statistically predicted score
If you compare both sides for and against for the entire season the Roosters will win 20.5 – 17.8.
If you compare the Roosters record in Sydney against the Raiders record on the road the Chooks come out 23.7 – 16.7 winners.
If you compare both sides’ records against the other top four sides the Roosters will win 19.5 – 16.2.
The likelihood is that the Roosters will win by four points and the total points for the game will be under 40.
Roosters by four