


WATCH: Young Cat gifts Sun easiest goal of his life with all time ruckman moment
Not Toby Conway's finest moment!

With more than half the home-and-away season in the books, we have a decent sample size of what each team does well – and not so well.
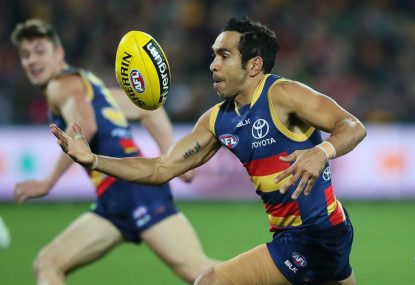
Adelaide
As the highest-scoring team in the competition (113.5 per game), it’s no surprise the Crows have the equal highest number of players with 20 or more goals through 12 rounds with four – Jenkins (37), Betts (33), Walker (29) and Lynch (21).
Adelaide are also the most efficient team in terms of scoring a goal when they get the footy inside 50, putting it through the big sticks on 30 per cent of entries. Defensively, the Crows concede 88.8 points a game, which is ranked eighth and the worst of the top-eight teams. They’re ranked seventh in both clearance and contested-possession differentials (+15 and +32 on the season respectively).
Brisbane Lions
To no one’s surprise, the numbers aren’t kind to the Lions, who are dead last in in the two categories they’ve been terrible in for years – contested possession differential (minus-174) and clearance differential (-97). Brisbane also concede a goal on 32 per cent of opponents’ forward-50 entries, which is ranked 18th and is far from ideal when you consider they are also 17th in terms for inside-50s against (more than 60 a game) and have let their opponents take more marks inside 50 than any other team (16.5 per game).
That all adds up to the leakiest defence in the competition with opponents averaging slightly more than 126 points a game – yikes. Brisbane are also ranked last for disposals. There are few positives, though they are middle of the road for tackles – ranked ninth at 69.8 per game.
Carlton
In the simplest of scoring terms, the Blues are vastly improved on last year, improving their offence from 69 points a game to 76 (ranked 17th, despite the increase) and tightening their defence from 107 points to 90 (a respectable ninth). Essentially, they’re a four-goal better side, which is nothing to sneeze at.
They are mid-table in most categories, including marks inside-50 (sixth), marks inside-50 against (seventh), inside 50s against (eighth) and percentage of goals conceded per inside-50 (ninth at 25 per cent). Somewhat surprisingly, the Blues are ranked 17th in clearance differential (-4.5 per game). The attack still needs work, Carlton are one of only three teams without a 20+ goalkicker and manage a goal on only 22 per cent of their forward entries, ranked 17th.
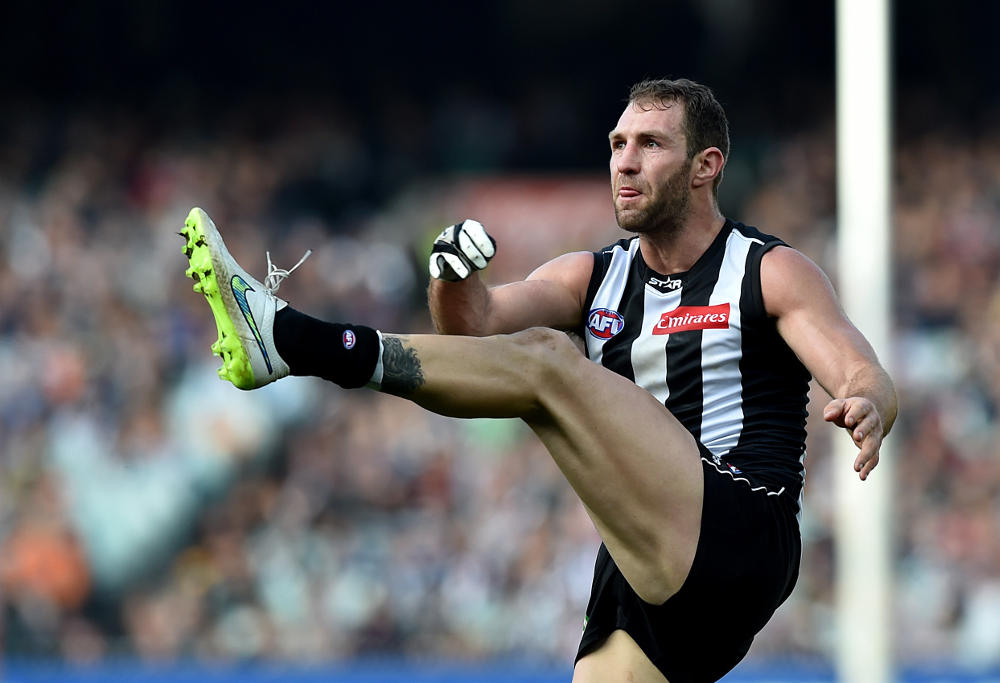
Collingwood
It’s been a miserable season for the Pies and the numbers reflect that.
Ranked 13th in scoring at 83.4 points a game and 14th for points against at 98.7 points a game. The Magpies are ranked fourth in both tackles (74.7 per game) and tackle differential (+6.3 per game), but that might have something to do with them constantly chasing tail – opponents average 24.5 more disposals per game, which is 15th. And if you’ve seen how easily several opponents have managed to kick over the top of the Collingwood zone, you won’t be surprised that they are conceding 15 marks per game inside their defensive 50 (ranked 15th).
Injuries to Jamie Elliot and Dane Swan, and the seeming demise of Travis Cloke, have certainly been felt, with just three Magpies (including wounded pair Alex Fasolo and Darcy Moore) booting double-digit goals – equal lowest in the AFL.
Essendon
The decimated Dons have done about as well as could be expected given the circumstances. Ranked a clear last in scoring at 58.1 points a game, which is almost three goals worse than the 17th-ranked Blues.
The defence isn’t quite so messy, ranked 16th at 107.2 points a game. Their chip-around style means the Bombers are ranked No.1 in the competition for marks (101.3 per game) and second for disposals (398).
They do, however, also concede the most marks (103.8) and disposals (401), and are 17th for marks against per inside-50 at 15.7 a game. Essendon are converting a league-worst 18 per cent of their forward entries into goals while they are slightly better defensively, giving up a goal on 27 per cent of opponents’ entries (ranked 14th). The midfield is fighting manfully, ranked 12th for clearance differential at minus-29 (one spot better than the Hawks!).
Fremantle
For all their struggles, the Dockers are still doing a lot decently. Without two of footy’s most influential clearance players – Aaron Sandilands and Nat Fyfe – Fremantle are ranked fourth in the competition for clearance differential (+1.9 per game). They are also sixth for total tackles (averaging 72.6 a game), but opponents are still out-tackling them (75.3).
Last season the Dockers were the No.2 contested possession team in the league with a differential of 9.7 per game, this season, they are down to 11th at -2.4 per game. Freo’s scoring continues to be a problem, they are 14th for inside-50s per game (47.9) and 14th for converting those entries to goals at 24 percent, all of which adds up to the 15th-ranked scoring team at 80.6 a game. Defensively, they are conceding the fifth fewest inside-50s, but giving up goals on 27 per cent of those entries, ranked 15th.
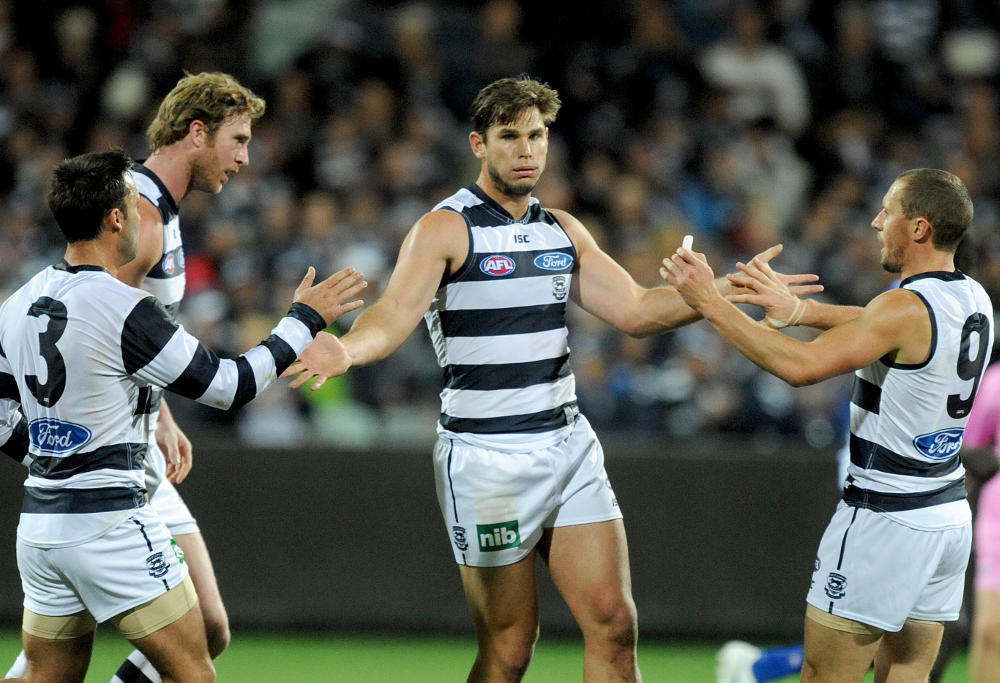
Geelong
The Cats are doing a hell of a lot right. Ranked third for scoring at 104.3 points a game and third for points against at 75.1 points a game. First for inside-50 differential (+13.8 per game), third for contested-possession differential and fourth for clearance differential.
Their shoddy goalkicking means they are converting only 26 per cent of their inside-50s into goals, which is about league average, though they are third for scoring shots per inside-50 at 46 per cent – if they can tidy up their accuracy, look out. First for marks inside 50 (15.3 per game) and marks inside-50 against (8.4). They have also conceded the fewest scoring shots of any team. Sharing the goalkicking load well with six players in double digits and three players with 20 or more goals. Impressive.
Gold Coast
The Suns just can’t get their hands on the footy, ranked 17th for disposals (350 per game) and disposal differential (-38.9 per game), and 16th for both clearance and contested-possession differentials (minus-53 and -149 on the season respectively).
There has been much discussion about the heavy reliance the Swans have on Lance Franklin, but Gold Coast have an even greater reliance on young gun Tom Lynch, who has booted 39 of their 143 goals (27 per cent, compared with Franklin’s 25 per cent). The Suns have the worst inside-50 differential in the competition at -14.3 per game, have conceded the third-most marks inside 50 and are giving up goals on 27 per cent of opponents’ forward 50 entries (16th). Not a lot is going right.
Greater Western Sydney
The league’s No.2 scoring team at 107.5 points per game, the Giants are also fifth in defence, conceding just 79.3 per game. They are converting 28 per cent of their inside 50s into goals (ranked second) and conceding goals on only 22 per cent of opponents’ entries (also second).
Ranked second for marks (101.3 per game) and disposal differential (+39 per game), third for disposals (391), second for clearance differential (+5.9 per game), fourth for contested-possession differential (+8.6 per game) and fifth for tackle differential (+6.1 per game). They have seven players with 10 or more goals (equal best) and three of those players have at least 20. There’s not much they don’t do well; the future is now.
Hawthorn
What to make of the Hawks? Statistically, they’re bipolar. Fourth ins coring at 102.9 per game and seventh for points against at 86.5. Contested possessions haven’t been a strength of Hawthorn’s, but they’ve plummeted from eighth last year and a positive differential (+1.5) to 17th and a differential of minus-13.4 per game – that’s ahead of only the woeful Lions and behind both the Suns and Bombers. The three-time defending champs are 13th for clearance differential (-29 on the season).
They are third for inside-50 differential, pumping the ball into their attack on average 10 times more than their opponent and give up only 76.6 marks per game (ranked first). Conceding goals on 28 per cent of opponents’ inside-50s, which is ranked 17th, thankfully they concede only 46.3 inside 50s per game (ranked third). Six Hawks have booted at least 10 goals and four of them (Gunston, Breust, Rioli, Puopolo) have at least 20, which is tied with the Crows for the highest number in the competition. I don’t know how good they are, but suspect nobody wants any part of this mob in September.
Melbourne
The Demons have jumped an incredible 30 points per game this season from 72 last year to 102 this year, making them the fifth-highest scoring team in the competition. Melbourne have cracked the ton six times in the first 12 rounds, prior to this season they’d done so six times in their previous 70 games.
The midfield seems to get better by the week and they are currently third for clearance differential (+5.1 per game) and fifth for contested-possession differential (+6.1 per game). The forward line is coming together nicely too, converting 28 per cent of their inside-50s (ranked third) and with an equal-best seven players with at least 10 goals. Defensively, there is some work to do, but they’re mid-table in most measures. 11th for points against (93.5 per game), seventh for inside-50s against (52 per game) and conceding goals on 26 per cent of entries (11th). Somewhat surpisingly, they are 16th for tackle differential at minus-9.3 per game.
North Melbourne
The Roos might sit on top of the ladder, but they can’t get no respect (insert Dangerfield joke here). After a tough few weeks they have slipped to seventh in scoring at a fraction over 100 a game and they sit middle of the road in a lot of categories: Eleventh for disposal differential (-10.7 per game), tenth for inside-50 differential (+1.9) and clearance differential (-1.5) and ninth for contested possession differential (+1.7).
North are far and away the best tackling team in terms of differential, Ziebell, Swallow, Cunnington and Co. out-tackling opponents by almost 10 a game. Given their tall talent up front, North are a surprising ninth for marks inside 50, though they do convert when they get it in there, splitting the big sticks on 28 per cent of entires (ranked fourth). Seven players with ten or more goals is as good as any team and three of those players have at least 20.
Port Adelaide
Have the Power put it together or are they just teasing again? They have conceded 54.8 inside-50s per game, (ranked 13th), but conceded goals on just 24 per cent of those entires (ranked sixth). Have been a poor clearance team (-48 on the season, ranked 15th) and are also ranked 13th for contested-possession differential (-11.7 per game). They have laid the second most tackles in the AFL (78.5 per game) but taken the second-fewest marks (74.3 per game).
They’re certainly scoring enough (100.4 per game, ranked sixth) and six Power players have booted at least ten goals (three at least 20). They’ve got work to do if they are to break into the eight.
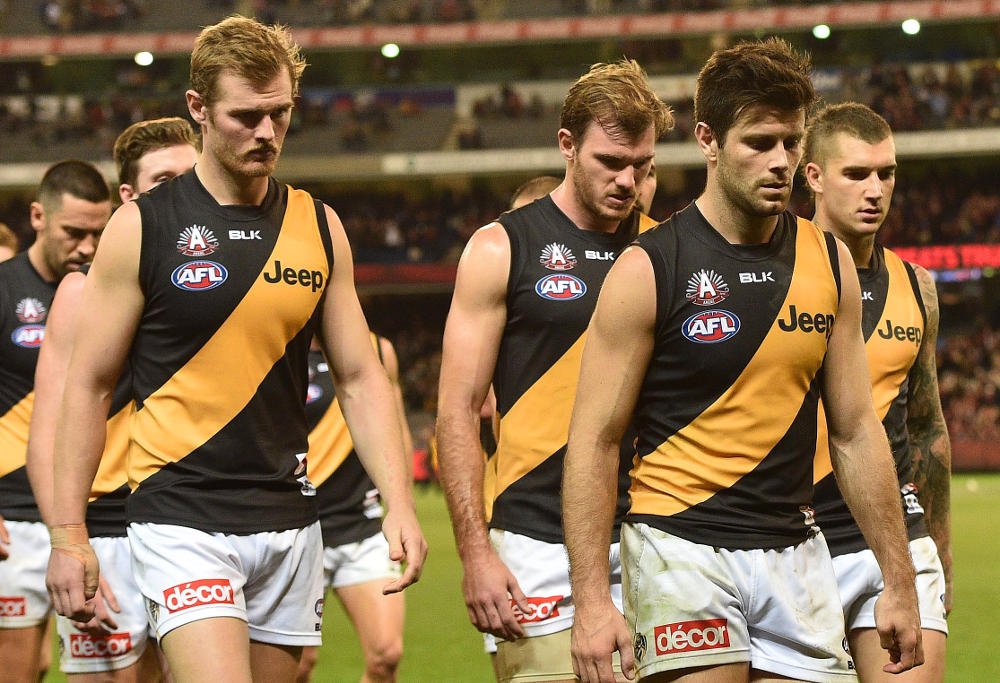
Richmond
Cards on the table, I had this lot finishing second. Oops.
In what’s looking like a lost season, the Tigers are ranked 15th for inside-50 differential per game (-7.9), but have at least managed to grab it when they get it forward, taking 164 marks inside 50 (ranked third). They haven’t been disgraced at the contest, ranked eighth for contested-possession differential (+2.4 per game) and sixth in clearance differential (+1.6 per game), though they are ranked 17th for tackles (63.2 per game) and have been out-tackled by an average almost nine per game (15th).
Not scoring enough (85.8 per game, 11th) and conceding too much (101.3, 15th). Only four players have booted 10 goals, though three of them have at least 20. Meh.
St Kilda
The Saints are 0-7 against the top nine teams and 5-0 against teams in the bottom half of the ladder. Hmmm. They have been been belted in contested possessions (-10.2 per game, 14th) and are 11th in clearance differential (-2 per game). Bruce, McCartin and Membrey have shown plenty (and that old bloke Riewoldt goes okay as well), which has led to them taking an average of 13.3 marks inside 50 (fifth in the league).
They’re defending pretty well at the other end when opponents get it in their forward 50, conceding goals on 26 per cent of entries (eighth), but unfortunately it’s getting in too often (55.7 times a game, 15th). The Saints are Out-tackling their opponents by seven a game, ranked third. A club that’s improving.
Sydney
Perhaps the Swans used up all their bullets early, because the offensive firepower we saw in the first month is no longer there – they haven’t cracked the ton since Round 8 and their scoring average has dipped below 100 to 98.5 (ranked eighth). That’s not to say Sydney aren’t a damn good team, they’re just playing a more familiar Bloods style.
Their 939 tackles on the season is 90 more than the next-best team, they’re second for contested-possession differential (+127 on the year), points against (72.4) and marks inside-50 against (9.3 per game), and are the stingiest team when opponents get the ball inside forward 50 – conceding a goal on only 19 per cent of entries.
Last for marks taken (74.1 per game), the Swans are also third for marks against (79.7). Their inside-50 differential of 6.3 per game is ranked fourth and they’re fifth for disposal differential. Five Swans have booted ten goals, but Buddy is the only one to crack 20.
West Coast
The Eagles’ attack hasn’t been as formidable as most expected. They’re averaging a fraction under 100 points, ranked eighth. The defence is holding up well, though, conceding only 79 points a game (fourth). West Coast are ranked fifth for inside-50 differential (+5.9), second for marks inside 50 (14.3), eighth for clearance differential (+1.1) and sixth for contested-possession differential (+3.3) and have the second-worst tackle differential (-122 on the season). They are still spreading the scoring load, with seven players having booted 10 or more goals. Not yet the team most expected them to be.
Western Bulldogs
The Dogs are animals around the footy, on historic pace for contested-possession differential. Luke Beveridge’s Bulldogs are averaging 24.4 more contested possessions than their opponents, which, if they maintain it, would better the 2006 Eagles’ mark of 18.5 per game as the best since Champion Data started keeping records in 1999.
Also No.1 for points against (71.4 per game), clearance differential (9.2 per game), disposals (433), disposal differential (77), inside-50s against and free-kick differential (+77, 47 more than any other team). Dead last in tackle differential at minus-137 on the season, which makes sense given how they’re usually first to the footy. Second for inside-50 differential (+12.1 per game).
Despite all that footy, the Dogs are scoring just 91.9 points a game (ranked 10th) and converting only 24 per cent of their inside-50s into goals (ranked 15th). Six Dogs have 10 or more goals, but Jake Stringer is the only one to crack 20.
Not Toby Conway's finest moment!
Former St Kilda player Sam Fisher has received a jail sentence of five years and four months over drug trafficking and drug possession. The…

The Blues Radio caller wasn't happy when the Demons Caleb Windsor was not pinged for holding the ball - and his Front Bar co-hosts…
The Collingwood member has been suspended for the rest of the season by the AFL after touching West Coast player Harvey Johnston during the…
The Port Adelaide midfielder was not happy with someone or something at the end of the Power's win over Geelong.


